
Find out more with SciForce free checklist
We use advanced drone cameras and 3D imaging, similar to technologies by Spar3D, Pointivo, and Loveland Innovations, for accurate roof evaluations. Our method helps to assess the roof damage by analyzing just two images. We identify key points on the roof, match them across images, and apply techniques like the 8-point algorithm for precise camera angle analysis and 3D detail capture. We apply keypoint triangulation to accurately map different areas of the rooftop, then adjust these measurements to real-world dimensions, ensuring precise and reliable evaluations.
By incorporating extra data like image depth maps, and drone movement and rotation details when available, our system achieves greater accuracy. We aim to streamline and improve roof damage assessment for the insurance industry through a blend of high-tech imaging and detailed analytical methods.
Deliverables
The web service has been implemented that provides REST API for uploading images and receiving damage annotations in addition to rooftop pic meta.
Technical Description
The service development has been split into the following main stages: damage detection, damage size computation, web app implementation, image quality assessment.
Damage detection
It was decided to use the Mask RCNN neural network algorithm for the detection of damaged regions. This approach has proven to be a great candidate for the task of instance segmentation in various areas. It allows the extraction of fine-grained bounding boxes together with polygons representing region shape. Instance segmentation with precise bounding boxes serves a very different purpose in the warehouse tracking case: detecting and tracking labeled boxes across multi-camera zones in a high-volume distribution center rather than mapping damage boundaries on rooftops.
The method implies that we’re using several neural networks for doing a subset of tasks. Initially, the backbone network extracts features of the image, then so so-called Region-Proposal Network (RPN) gives regions that are more likely to contain regions of interest (ROIs) and after that in the last stage third neural network regresses the bounding box inside this ROI together with binary masks describing shape and label classification.
Damage size computation
To compute the actual damage size it’s required to calculate the shingle dimension that encloses this damage area. So the key part of this stage happened to be the correct detection of shingles’ boundaries. Initially it’d been decided to apply pure image processing algorithms for highlighting gaps between tiles followed by extracting closed contours assumed to be shingles.
However, this approach was rejected soon because of the impossibility of adapting heuristic algorithms for diverse image settings including different scales, perspective angle, lighting, and so on. The next step was deep learning-based edge detection for highlighting gaps between roof tiles. Іince it was not fine-tuned for this project, particularly on various images it failed to correctly determine the edges of shingles. The computer vision generalization article documents exactly this failure mode across industries: the gap between controlled test conditions and real-world deployment is where heuristic approaches consistently break down.
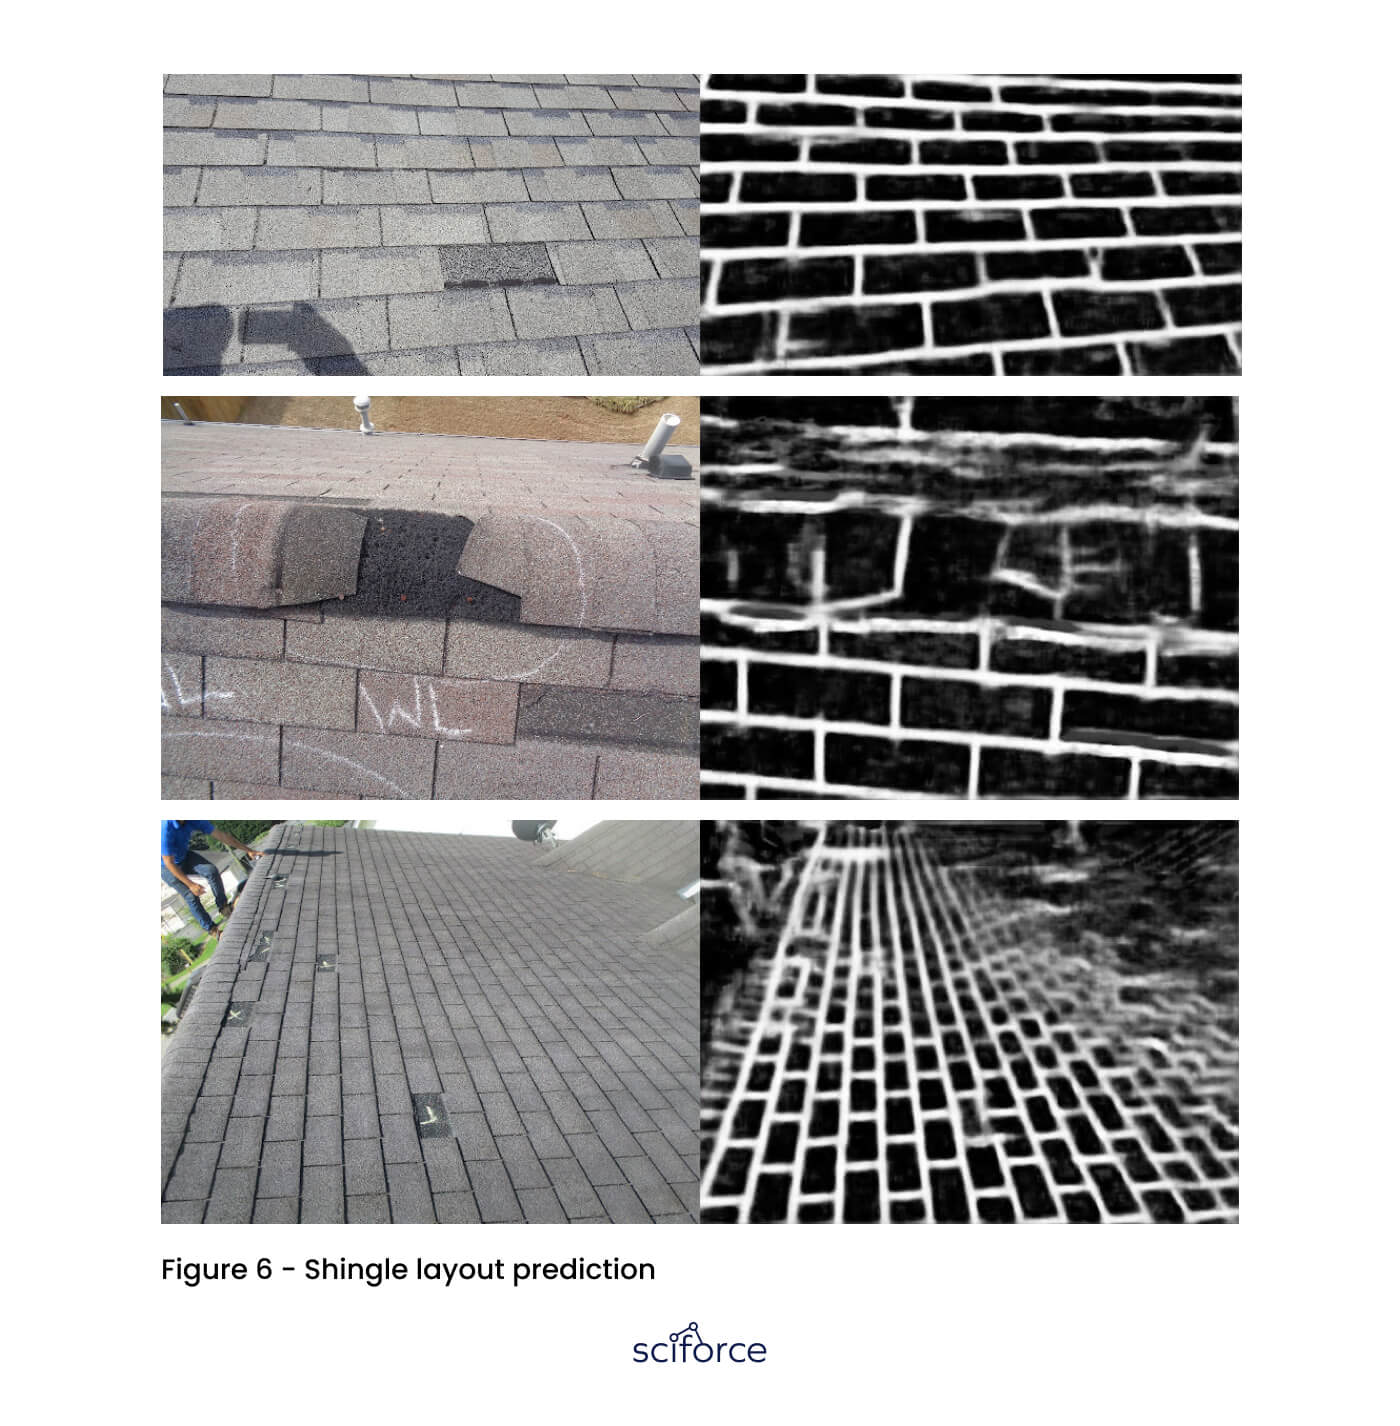
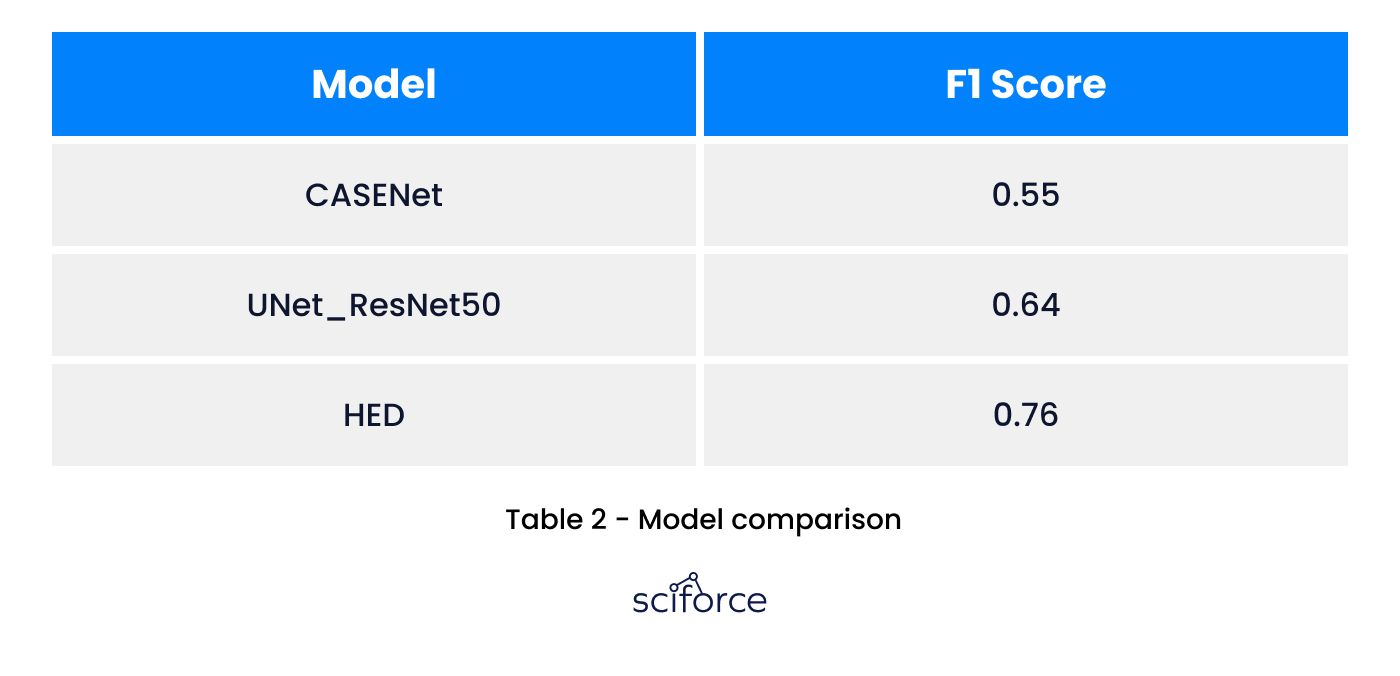
The situation was even more deteriorated by the fact that on some images the gaps (horizontal or vertical) were quite vague or completely indiscernible so the results were poor. So it’s been decided to train our model that would directly map the input image to the binarysmask representing the rooftop layout grid. We’ve tested several approaches including UNet, CASENet, and HED. The last one had been used in the previous step, so we’ve just trained it to serve our specific purpose. It occurred to be the best out of them.
So after extraction of the binary mask representing the rooftop layout grid, it becomes easy to extract contours representing shingles and compute their dimensions and subsequently damage size.
Web app implementation
Flask has been adopted as the prior web framework in the project. It’s lightweight and allows to integration all needed functionalities via extensions.
We have implemented 2 requests in the REST API. The first one allows us to retrieve result damage annotations rendered on top of the passed image. The second one lets you extract that annotation list in JSON format accompanied with rooftop image pic quality assessment information.
Image quality assessment
Image quality is computed regarding 2 criteria: blurriness, and scale. The first calculation is pretty simple. It’s just a computation of image Laplacian’s representation variance. The second criterion is quite tough to determine. The first approach was to extract lines from the edge image and then cluster them by angle to detect clusters of parallel lines. The great number of such dominant clusters would show that we have a low scale and a small - huge respectively. The assumption here is that on the low-scale images, there are lots of additional content that would bring its statistics and on the huge scale we won’t have lines at all or very few since there won’t be distinct tiles.
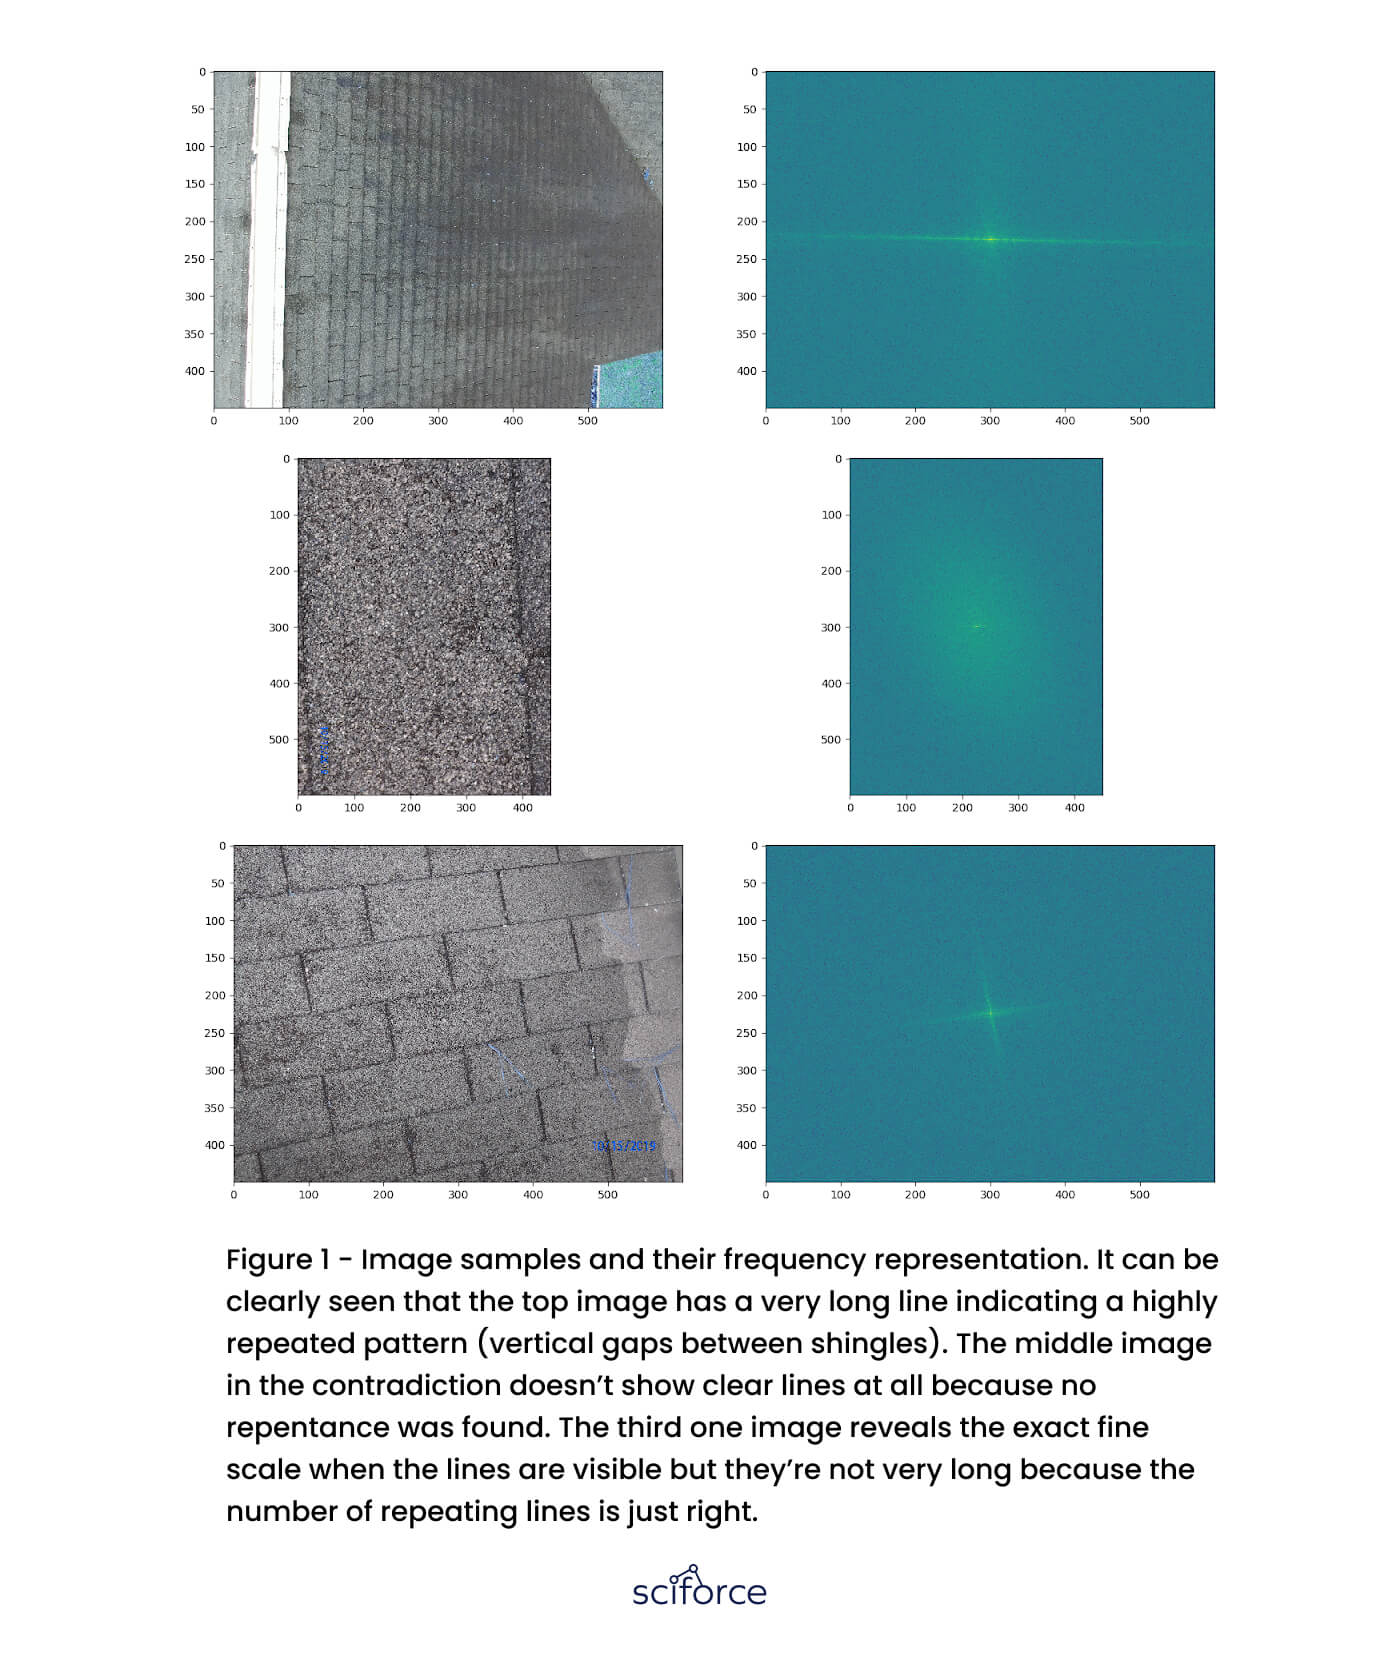
The current approach is directed toward analyzing the frequency terms of the image. The image undergoes Fourier transformation to extract its frequency representation. The idea is that on the low-scale image, a lot of repeated image patterns can be seen, meaning a rooftop shingle layout with a huge number of repeating parallel lines. On the low-scale image, this number would be much lower.
The project is written using Python 3.6 language. The main frameworks are the following:
Damage detection
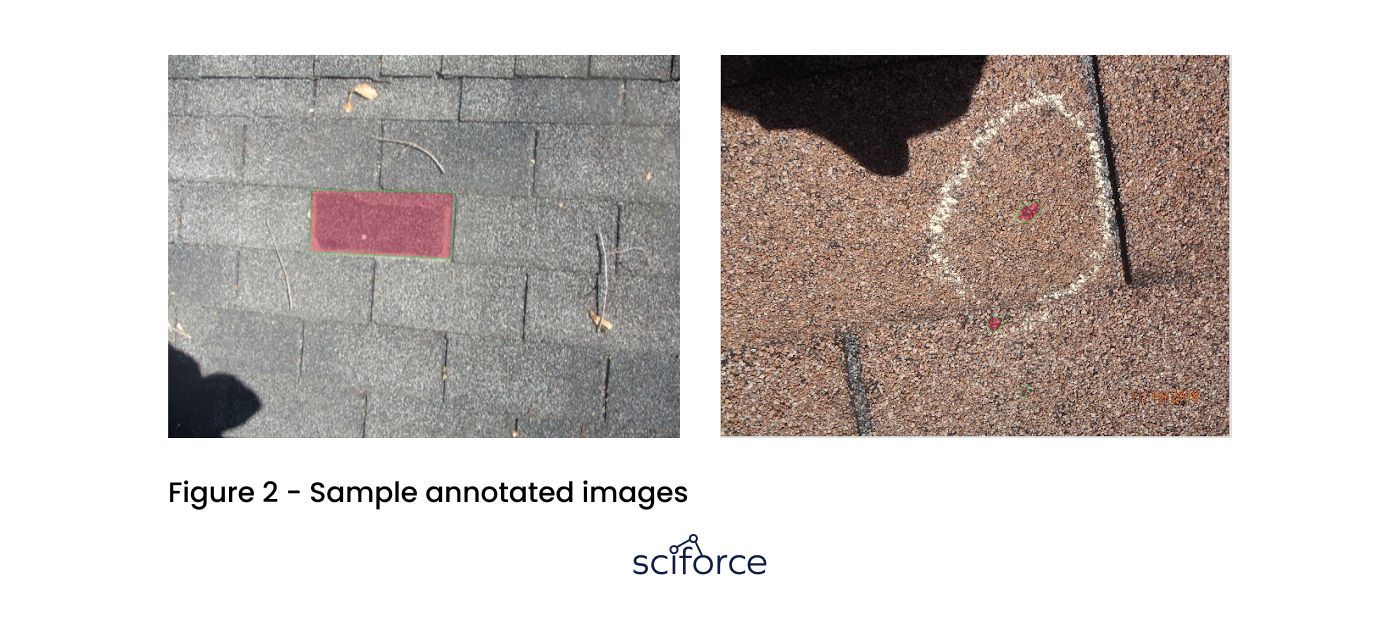
Dataset. The dataset comprises 297 images in the train set and 85 in the test respectively. They’ve been annotated manually using the DataTurks annotation tool.
Input Processing
The dataset preprocessing stage includes various the for both train and test sets to make the model more robust. The augmentations involve various image transformations such as rotation, scaling, and image filtration. To not exceed the GPU memory capacity during training the maximum annotations number limit has been imposed which is 8 annotations per image. Images that had more annotations were split to 4 tiles and fed to the model separately. During the training stage images were padded and downscaled to the same size of 800x800 pixels. The more resolution the GPU could not incorporate during the training stage. However, for inference, it’s been decided to keep a greater resolution of 1365 pix to capture more information.
Evaluation
The metric used for evaluation is mean average precision (mAP). It indicates how well the model can localize the objects combined with classification power. This metric is commonly used for object detection and instance segmentation tasks.
Model
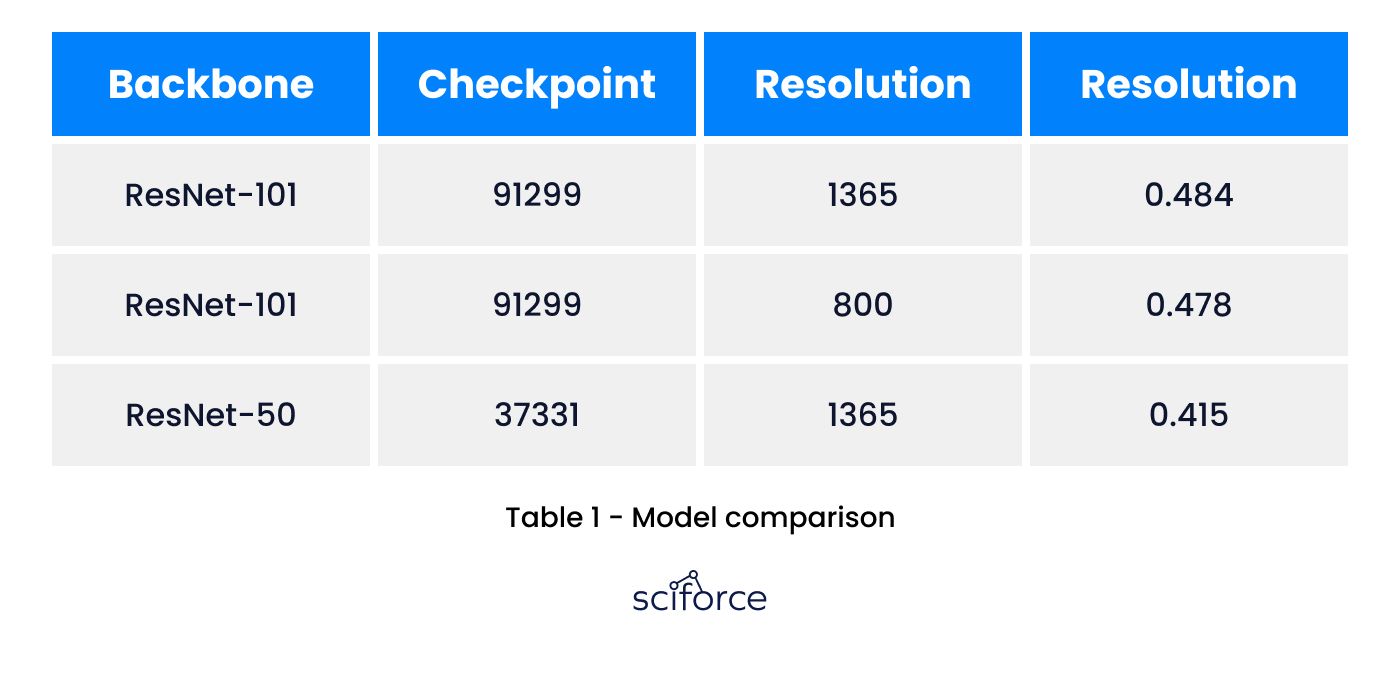
As we’ve adopted the Mask RCNN approach, we had to determine which feature extractor to employ as a backbone. In this project, several settings have been tested including InceptionV2, ResNet50, and ResNet101. The last one occurred to outperform the first 2 candidates on mean average precision metric (mAP) so it’s been decided to adopt this model.
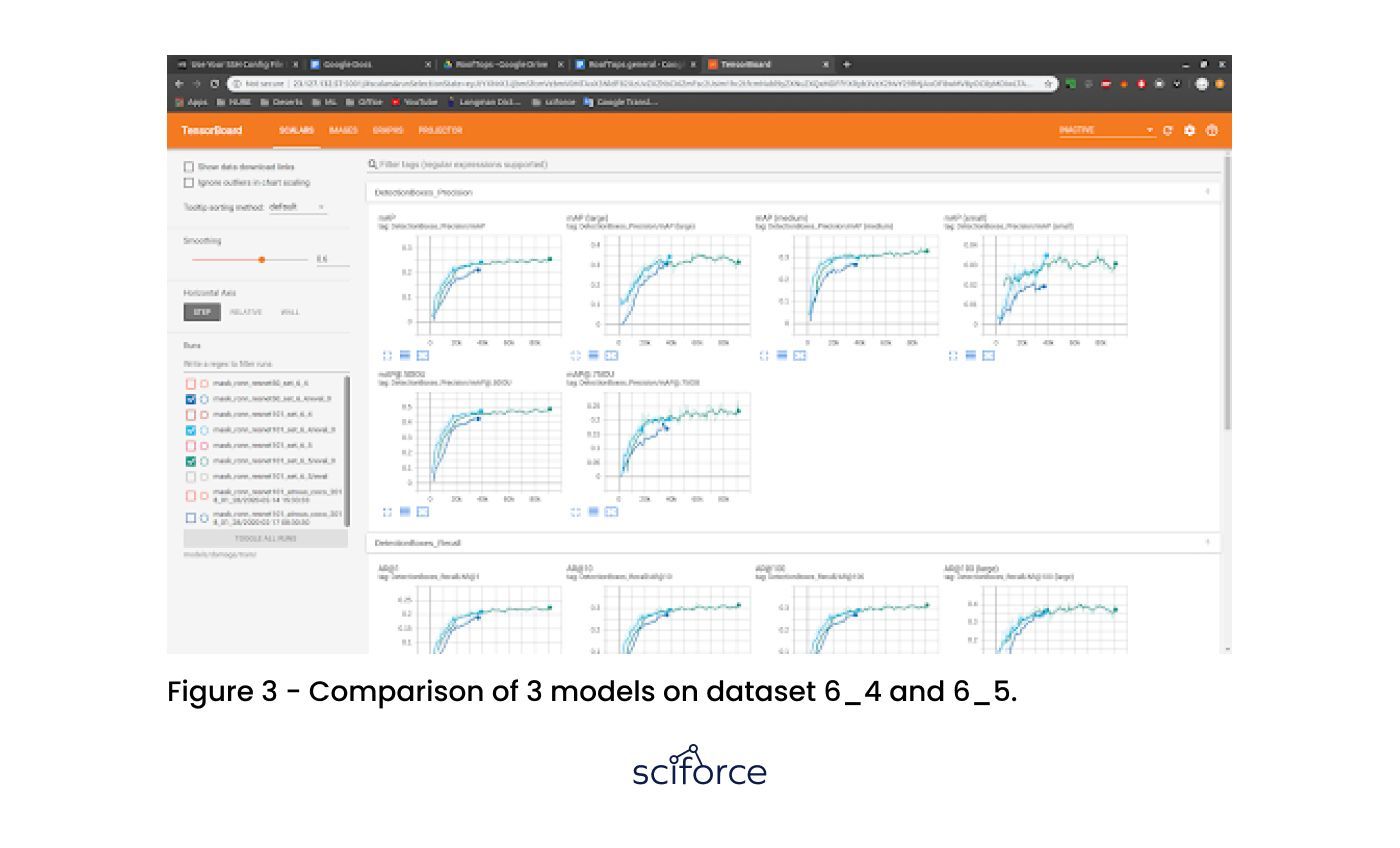
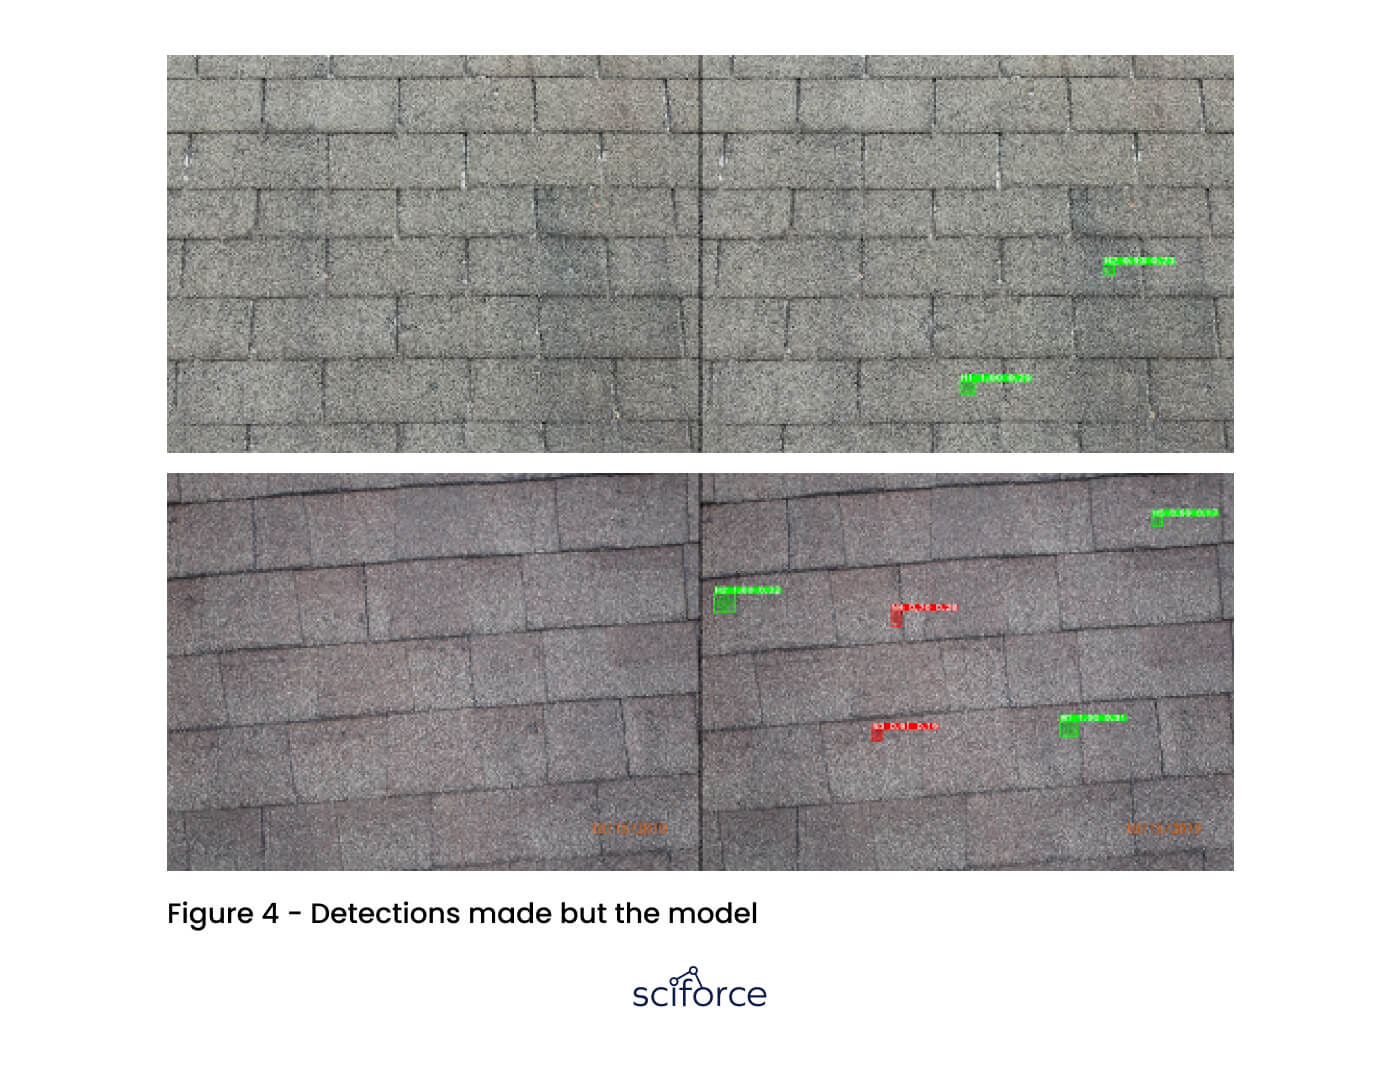
These sets contain the same source images, but 6_5 doesn’t put any weight on specific annotation samples to keep all of the damaged areas of equal importance. It can be seen that the model with the ResNet101 backbone outperforms ResNet50 after the same number of iterations. The final model has been trained for about 91k iterations and achieved a 0.484 mAP score which is quite decent.
Grid layout restoration
As we mentioned before for damage size estimation it’s required to compute shingle dimensions first. To do that we must detect shingles as well. The solution was end-to-end mapping of the input image to a binary mask representing the shingles layout.
Dataset: The train set constituted 194 samples and the test set - 21 respectively.
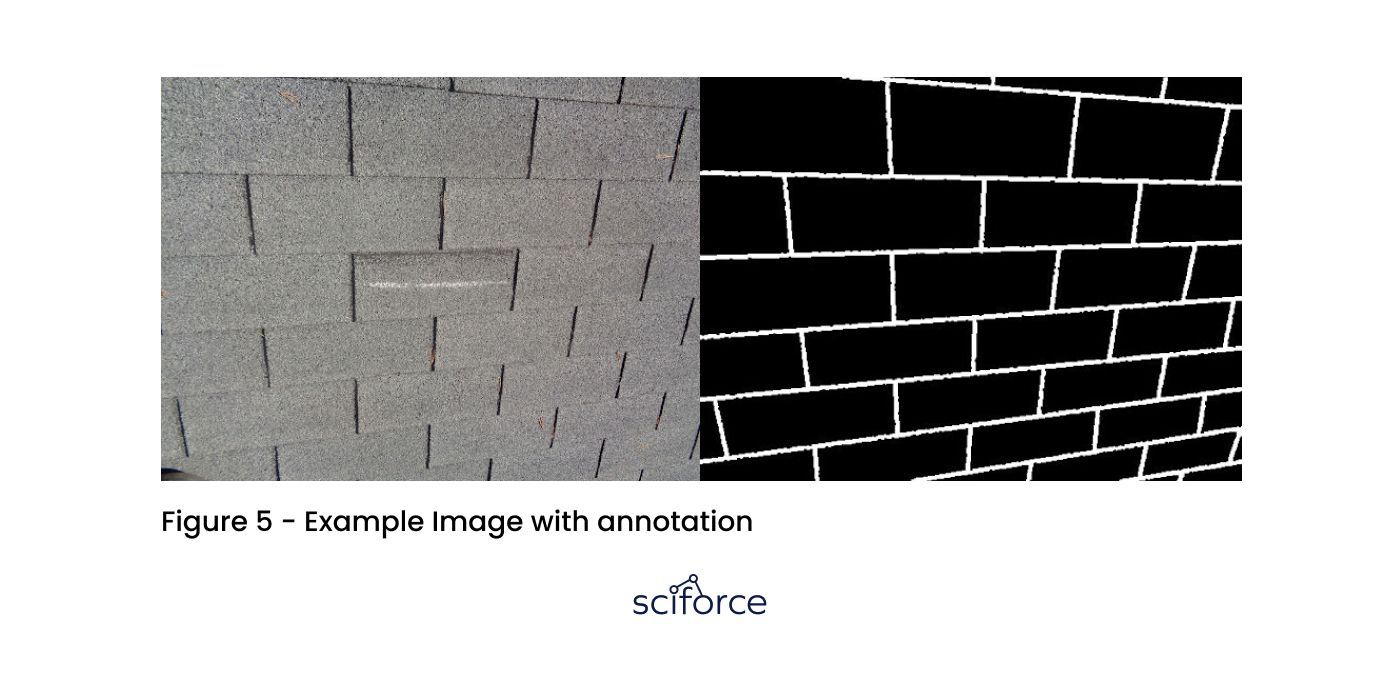
Input processing: Image augmentations involved rotation, translation, scaling, and image filtration. The model has been trained for 88 epochs.
Model: Several models have been tested. We’ve stopped on HED (Holistically-Nested Edge Detection). The model originally designed to perform deep learning edge detection, has been fine-tuned to better serve our purpose.
Damage Size computation
Dataset: The Test dataset comprises 178.
Model: The HED model from the previous step is used for this algorithm
Metric: Accuracy is the main metric for assessing size computation. The predicted value was considered correct if it diverged from the ground truth value no more than a specified threshold.
Results 0.74 % accuracy.
The solution proposed in this project doesn’t have analogues. Although we’ve used common well known techniques we’ve adapted them for this nontrivial task. The algorithm can be expanded to serve additional needs of course. For example we could detect other types of damage not including shingle damage but also metallic ones.