Find out more with SciForce free checklist
1. Waitstaff Response & Efficiency
We started by detecting waiter response time and table cleanup delays with video analytics. In many cases, it took more than 5 minutes for a waiter to approach guests after they sat down, especially during busy hours. After guests left, the tables located in less visible areas remained dirty for 10-15 minutes or longer. These delays often happened in the parts of the restaurant that were farther from the staff stations or harder for waiters to see.
2. Lack of Service Cycle Tracking
There was no automated way to monitor the full customer service cycle – from seating to order placement, food delivery, cleanup, and table availability. This made it difficult to measure the performance, identify delays, and therefore improve specific stages of the dining experience.
3. Zone-Based Visibility Problems
The staff didn’t have a real-time view of what was happening at each table – like whether a table had new guests, was waiting for a waiter, or needed cleaning. This made it harder to manage service efficiently, especially in restaurants with two separated dining rooms. Some tables were in hard-to-see spots, like behind walls or in corners, so staff only noticed them through the security cameras.
4. Real-Time Awareness & Coordination
The staff didn’t have a central screen to monitor table activity in real time. They had to walk around and check manually, which slowed them down – especially in busy hours or multi-room layouts. Without a color-coded system, it was hard to quickly see which tables needed attention, leading to a slower service and less efficient coordination.
5. Data Gaps in Decision Making
Management didn’t have access to data on how long tables stayed in each stage – from seating to order, and, eventually, to cleanup – or how staff activity varied throughout the day. There was no clear view of when waiters were busiest, for how long guests waited for service, or which time blocks consistently underperformed. Without this, shift planning was based mostly on assumptions or occasional customer complaints, rather than on measurable patterns.
6. Customer Experience & Reputation Impact
The restaurant received negative reviews, which mentioned long waiting time and uncleaned tables but couldn’t tell if these were rare incidents or signs of a larger issue. Without the clear data, it was hard to pinpoint what exactly needed an improvement to boost customer satisfaction and raise online ratings from 4.5 to 4.9.
 1) AI-Powered Table Monitoring System
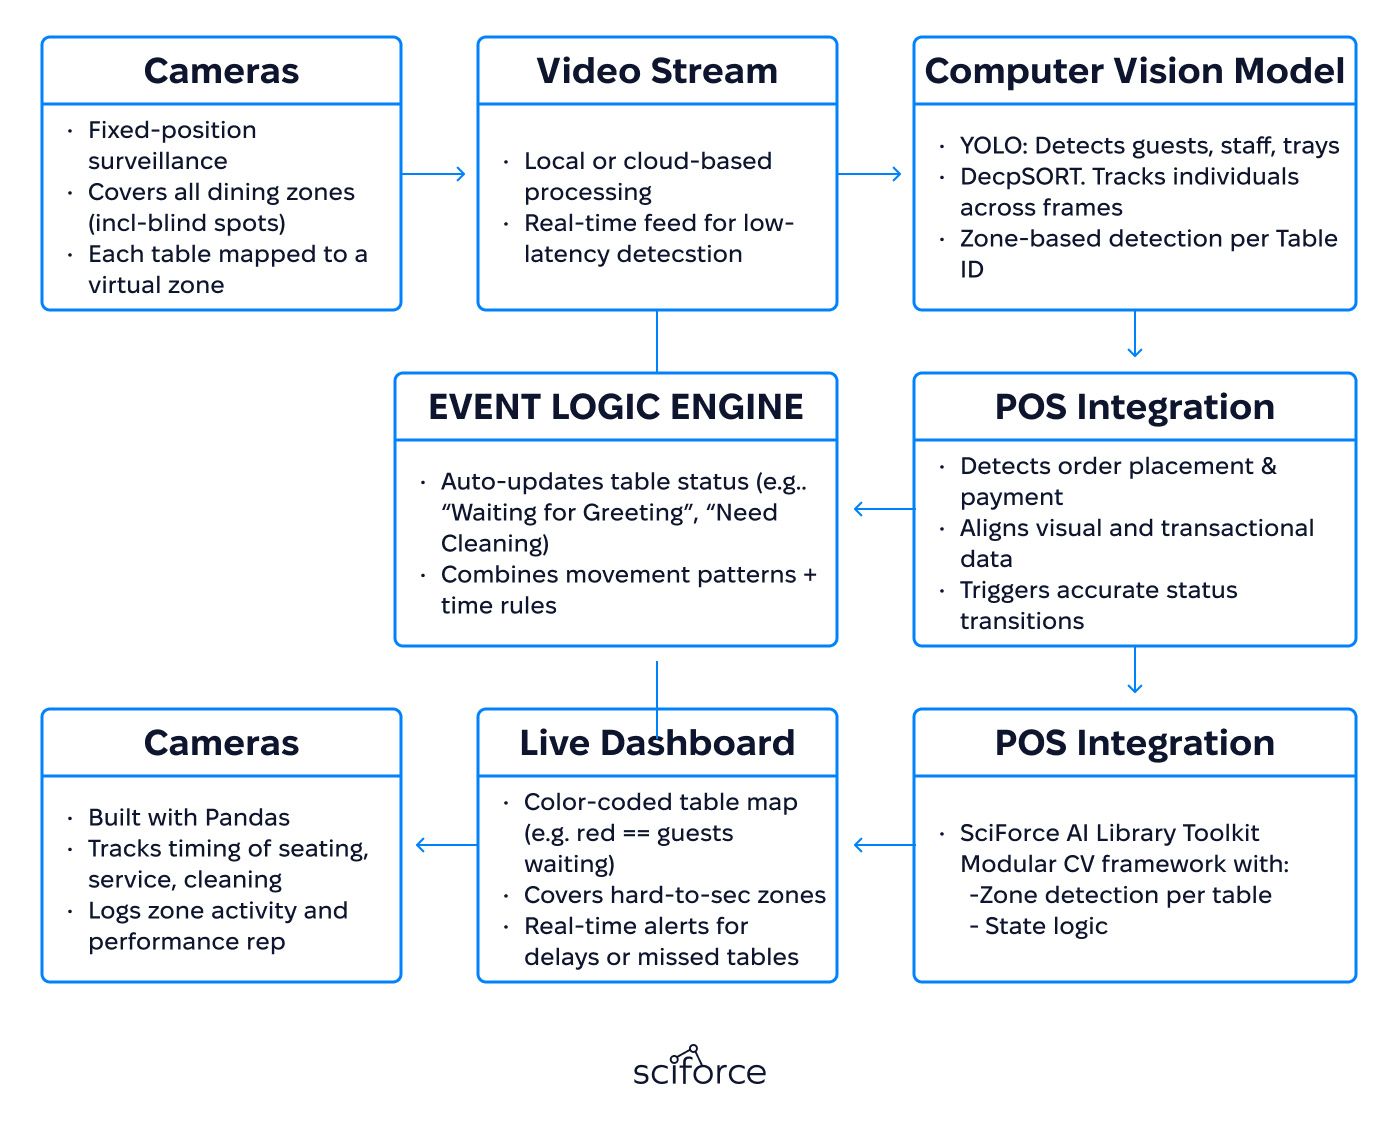
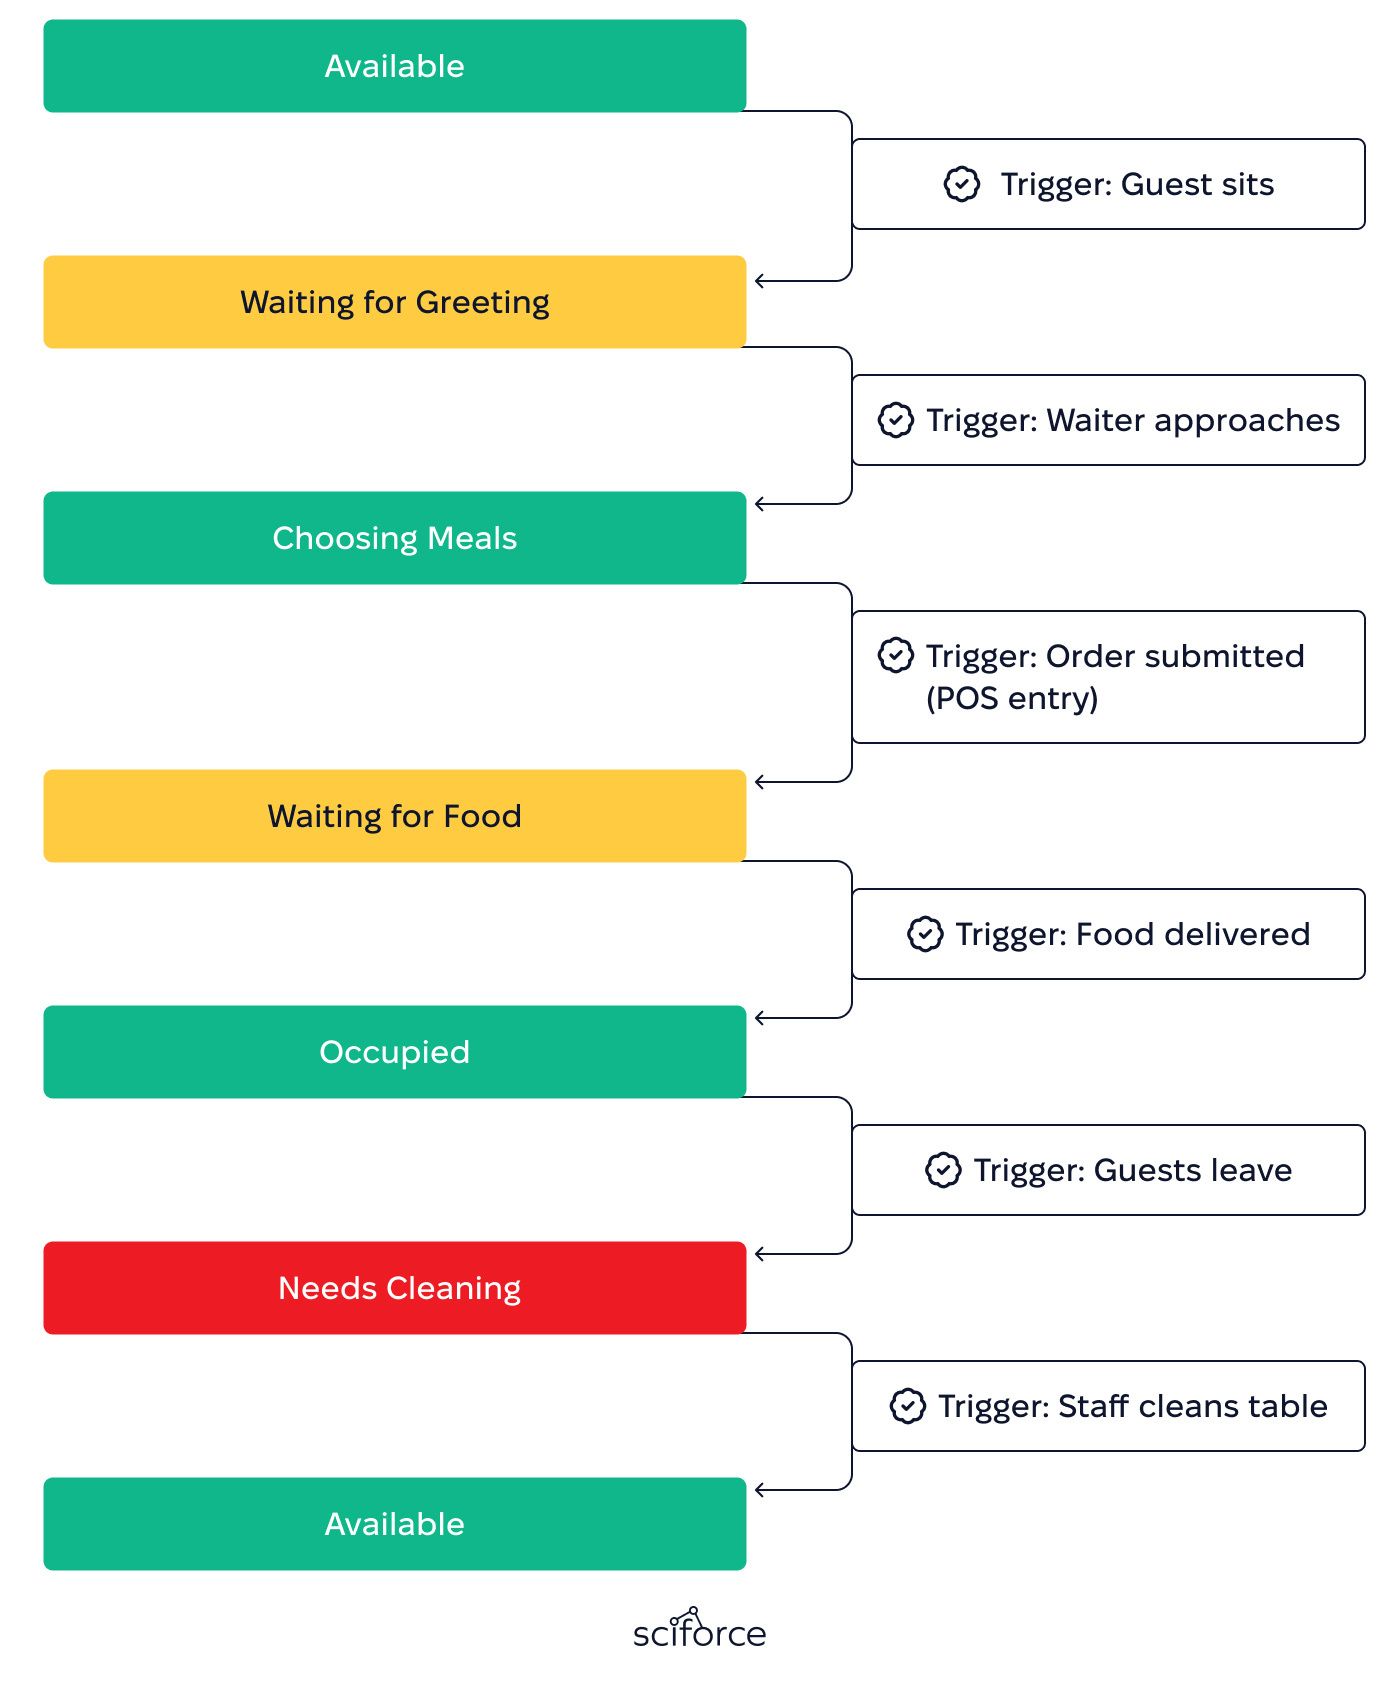
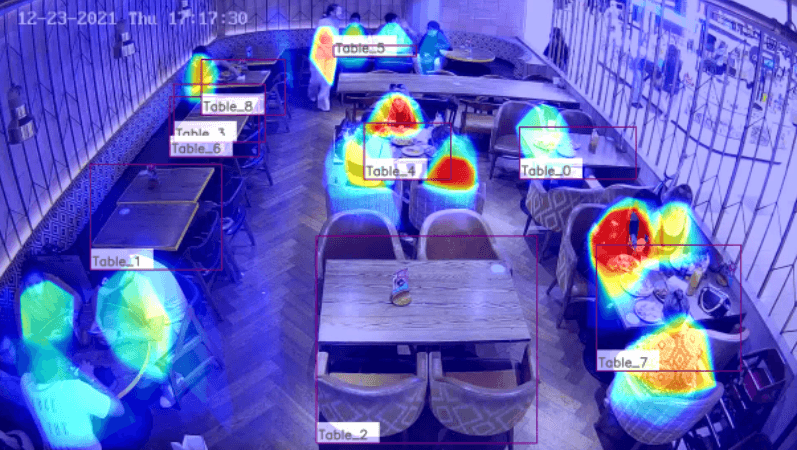
Each table is mapped to a predefined zone in the camera’s field of view. The system uses computer vision in hospitality to detect people and recognize key visual events – such as someone sitting down or leaving. These events trigger automatic status transitions (e.g., Available → Waiting for Waiter) based on a rule engine that monitors activity and timing within each zone.
2) Staff Detection and Differentiation
Waitstaff are differentiated from guests using a combination of visual classification (e.g., uniforms) and movement pattern analysis. This ensures precise tagging of staff-related events such as order-taking, food delivery, or table clearing.
3) Order Management System Integration
The system connects with the restaurant’s existing POS to automatically detect when an order is entered. This hospitality automation technology helps to update the table status (like switching from "Waiting for Waiter" to "Waiting for Food") and records important service events – without any extra work from the staff.
4) Service Area Visibility & Blind Spot Monitoring
The system continuously monitors all dining zones multi-camera activity tracking, including tables located in corners, behind walls, or in private sections. It automatically updates table status when guests arrive or leave, ensuring that staff is alerted to activity in less visible areas. This helps to reduce missed service opportunities and improves responsiveness.
5) Real-Time Status Display for Staff
The system continuously detects guest and staff activity and pushes the updated table statuses to internal systems. These updates are generated basing on the visual cues (e.g., seating, food delivery, departure) and POS data, therefore ensuring that each table’s state is accurately reflected in real time. This data feed forms the basis for all status-related interfaces.
6) Guest Journey Analytics & Timing Capture
The AI-driven restaurant management system continuously tracks customer activity, table turnover rates, and staff response times across different zones and times of day. Data-driven hospitality insights allow managers to identify peak service hours, detect recurring delays (e.g., slow cleanups or late food delivery), and make informed decisions on staff scheduling, table placement, and overall service strategy.
7) Data-Driven Operations Optimization The system continuously tracks customer activity, table turnover rates, and staff response times across different zones and times of day. This allows managers to identify peak service hours, detect recurring delays (e.g., slow cleanups or late food delivery), and make informed decisions on staff scheduling, table placement, and overall service strategy.
8) SciForce AI Library Toolkit
An internal modular framework built to support rapid development of a restaurant computer vision platform in production environments. It includes optimized components for key tasks like:
The real-time event detection with YOLO and DeepSORT is designed to plug into real-time dashboards or BI pipelines — the same components underpin our warehouse tracking system, where multi-camera zone analytics drove fulfillment optimization across a high-volume distribution center. It significantly reduces engineering overhead when tailoring solutions to different layouts, camera angles, or client requirements.
Smart Table Status Tracking
The system uses video and POS data to update table statuses in real time. It detects guest seating, waiter approach, order placement, and table cleanup – automatically switching between states like “Available,” “Waiting,” “Occupied,” or “Needs Cleaning” to help staff respond quickly without manual input.
Live Coordination Dashboard
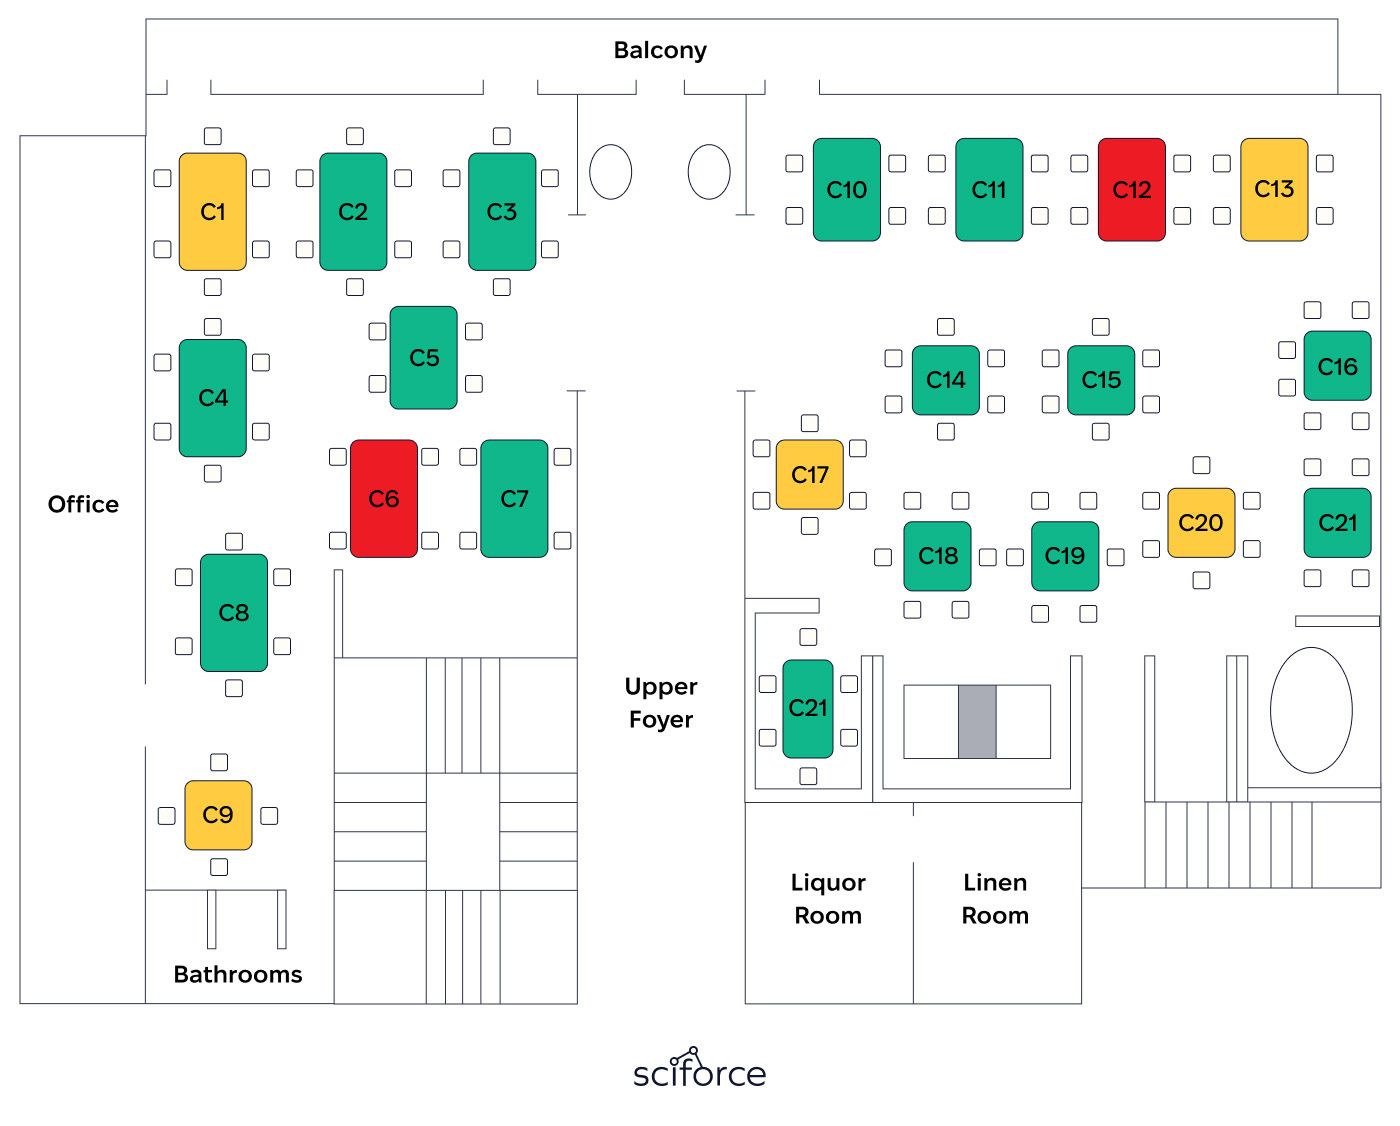
A visual interface placed in staff areas shows a live floor map with color-coded table statuses – e.g. , red for newly seated guests, yellow for in-progress service, and gray for dirty tables. The dashboard helps staff to quickly identify which tables need attention across multiple rooms or hidden areas, enabling faster response and better floor coordination.
Full Service Cycle Metrics
Provides detailed performance metrics for each stage of service, such as:
All metrics are available per table, per shift, or across locations, supporting operational reviews and staff performance tracking.
Zone-Based Activity Analysis for Hospitality Service Optimization
The system logs how much time guests and staff spend in specific areas — including tables, entry points, and service stations. This zone analytics approach is also at the core of EyeAI, our space optimization product for retail and HoReCa, which turns existing camera feeds into real-time visitor behavior insights. By analyzing these patterns, it identifies which zones are underused, frequently delayed, or overloaded. This data helps managers optimize seating layout, staff coverage, and overall service flow.
Automated Alerts & Notifications
The system tracks service activity in real time and sends alerts when thresholds are exceeded – for example, if no waiter approaches a new table within 3 minutes or a dirty table remains uncleaned after 10. Alert rules can be customized by time, zone, or event type. Notifications appear on staff dashboards or handheld devices to support faster response.
Exportable Reports & Data Integration
The system provides structured reports on table usage, service performance, and staff activity. Data can be downloaded or integrated into BI tools, supporting long-term planning, shift adjustments, and operational reviews with reliable insights.
1. Initial Setup
The system begins by mapping each table to a fixed virtual zone within the camera’s field of view, showing how to build a computer vision system for restaurant floor management. These zones are carefully aligned with the physical layout of the dining space to ensure accurate tracking. Each zone is assigned a unique Table ID, which is used to monitor table status changes, log service events, and link data across the video and POS systems.
2. Detection & Event Tracking
The system relies on computer vision for full-service restaurant operations management to monitor activity at each table, beginning with basic human detection – identifying when someone sits down, remains seated, or leaves. Each table zone is continuously observed for presence and activity.
To distinguish between guests and staff, the system uses:
These methods help the system reliably detect key service events, including:
To track the exact moment of order placement, the system integrates with the restaurant’s POS. When the waiter submits an order, this triggers a status change (e.g., from “Waiting for Greeting”, “Waiting for Waiter” to “Waiting for Food”) – aligning visual data with real transaction events and reducing the need for manual intervention.
3. Status Logic and Transition Rules
The system uses a set of predefined rules to automatically update each table’s status based on visual and POS-detected events. These rule-based transitions ensure accurate, real-time restaurant analytics without manual input. For example:
This automated logic ensures that each phase of the customer experience is tracked consistently and reflected in real time on staff dashboards.
4. Analytics and Tracking
The system logs all key service milestones with precise timestamps, including guest seating, waiter arrival, order entry, food delivery, and table cleanup. These events are automatically captured through a combination of computer vision and POS integration, allowing for detailed service timeline reconstruction per table.
Zone-level activity is analyzed using a dedicated module within the SciForce AI Library Toolkit. This tool tracks how long guests and staff spend in defined areas (such as tables, service lanes, or entry points), measures movement trajectories, and counts zone entries and exits. The generated insights help to identify high-traffic areas, underused zones, and recurring bottlenecks – supporting layout optimization, staff zoning, and operational planning.
5. Visualization and Staff Tools
The system includes a live dashboard placed in staff areas, showing the current status of every table. It updates automatically using video and POS data, so staff always see the most recent changes. Tables are shown in different colors to indicate what’s happening – for example, red for guests waiting, yellow for food on the way, and gray for tables that need cleaning. This helps staff decide quickly where to go next.
To cover hard-to-see spots like corners or private booths, cameras are set up to monitor those areas too. These zones are shown on the dashboard just like regular tables. When something happens there, it’s highlighted, so staff don’t miss it – even if they can’t see the area from where they are.
The solution is scalable and performs well whether it’s used in 10 venues or 100. The core computer vision components remain the same – any added complexity comes from infrastructure setup, not the algorithms themselves.
The SciForce AI Library Toolkit is a modular framework built to streamline the development of computer vision solutions for video surveillance. It includes reusable components for zone detection, status logic, event recognition, and analytics. Designed for flexibility, it adapts easily to various layouts and camera setups, and integrates with real-time restaurant service analytics with computer vision to reduce development time and ensure consistency across projects.
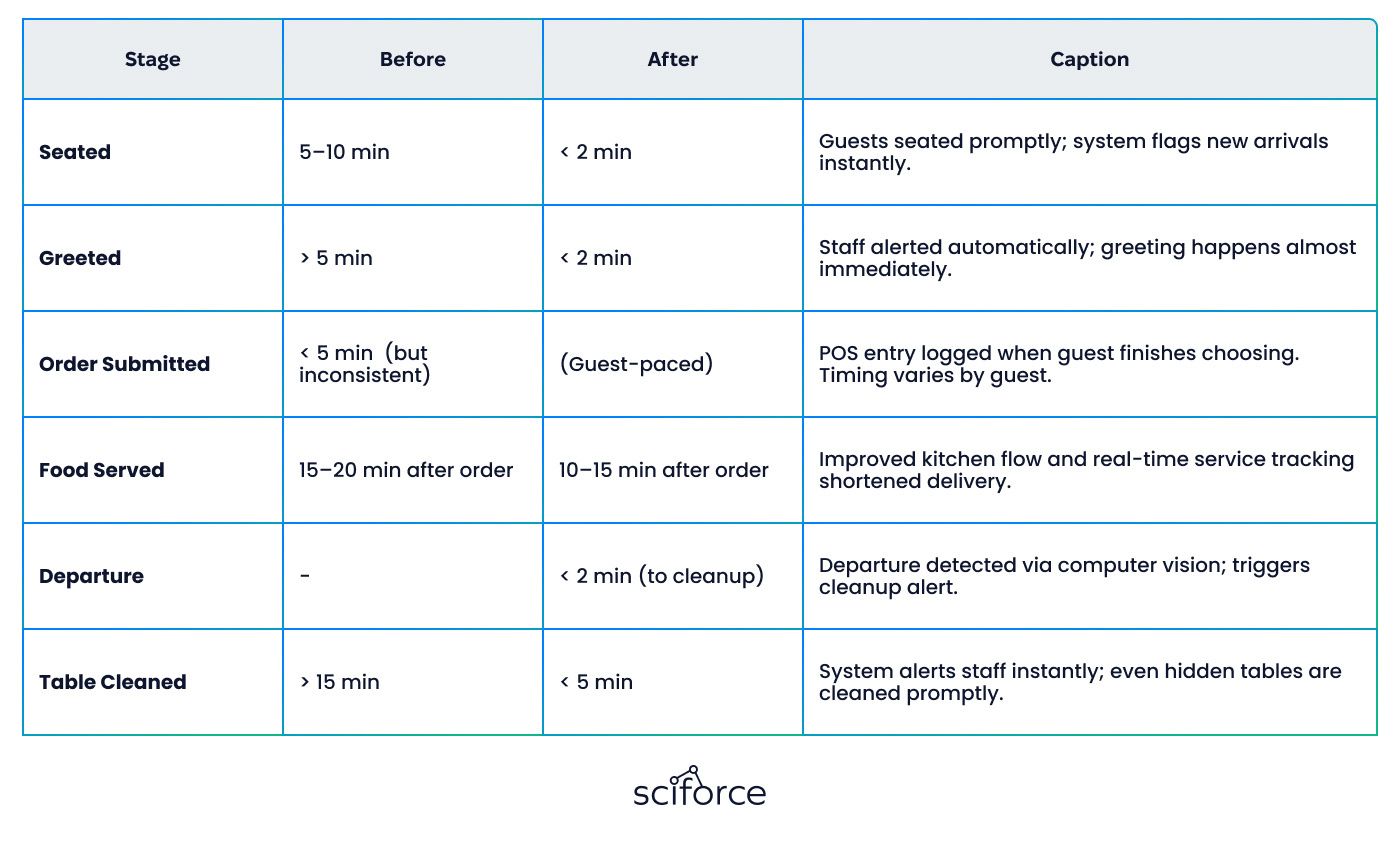
Waitstaff response time dropped from over 5 minutes to under 2 minutes, and table cleanup time decreased from 15 minutes to less than 5 , thus significantly reducing wait times for new guests.
Real-time dashboards and blind spot monitoring helped staff to stay aware of all table states\statuses, ensuring no guest or dirty table was overlooked, even during peak hours.
Data on guest traffic and zone usage helped management adjust shift schedules and redistribute staff more effectively, avoiding overstaffing or coverage gaps.
Visibility into underused corners and private booths led to layout changes and more balanced table usage throughout the day.
Within weeks of rollout of AI for customer satisfaction improvement, the restaurant’s Google rating increased from 4.5 to 4.7, driven by fewer service delays and cleaner, more responsive table management.