Find out more with SciForce free playbook
1. Delayed response to sudden customer surges
To address unattended counters and delayed response during sudden customer surges, the solution applies AI for pharmacy staffing optimization using cameras, enabling timely staff alerts when assistance is needed.
2. Ambiguity in customer intent and location
Without spatial zoning or movement analysis, the system struggles to tell whether a person standing near the counter is waiting in line, seeking help, or simply browsing nearby displays. This limits the accuracy of queue detection and undermines timely staff response.
3. Limited camera coverage in small spaces
Many pharmacies are small, with few places to install cameras. This makes it hard to set up multiple devices, so the system needs to work well with just one or two cameras and without complex setups.
4. High variability across 1,000+ store locations
Rolling out the system across a large network means dealing with diverse layouts, ceiling heights, lighting conditions, and camera placements. These differences impact detection accuracy and complicate setup. The solution must adapt reliably across all sites with minimal calibration.
5. No customer tracking
The approach relies on lightweight computer vision for people counting without video streaming, using periodic snapshots instead of continuous tracking to reduce infrastructure load. As a result, it’s not possible to measure how long each person waits or how long they spend being served.
6. Privacy and consent limitations
Analyzing customer age or gender through video may not be allowed unless customers have clearly agreed to it. This usually requires linking the video data to loyalty program members who have given permission. Without that, such features might not be usable.
7. Overcomplication risk
The system should be easy to set up and use on the pharmacy’s existing equipment. Adding complex features like real-time tracking or multi-camera setups could slow things down, require more technical support, and make the solution harder to maintain. It’s better to focus on the most useful features that work well without adding unnecessary complexity.
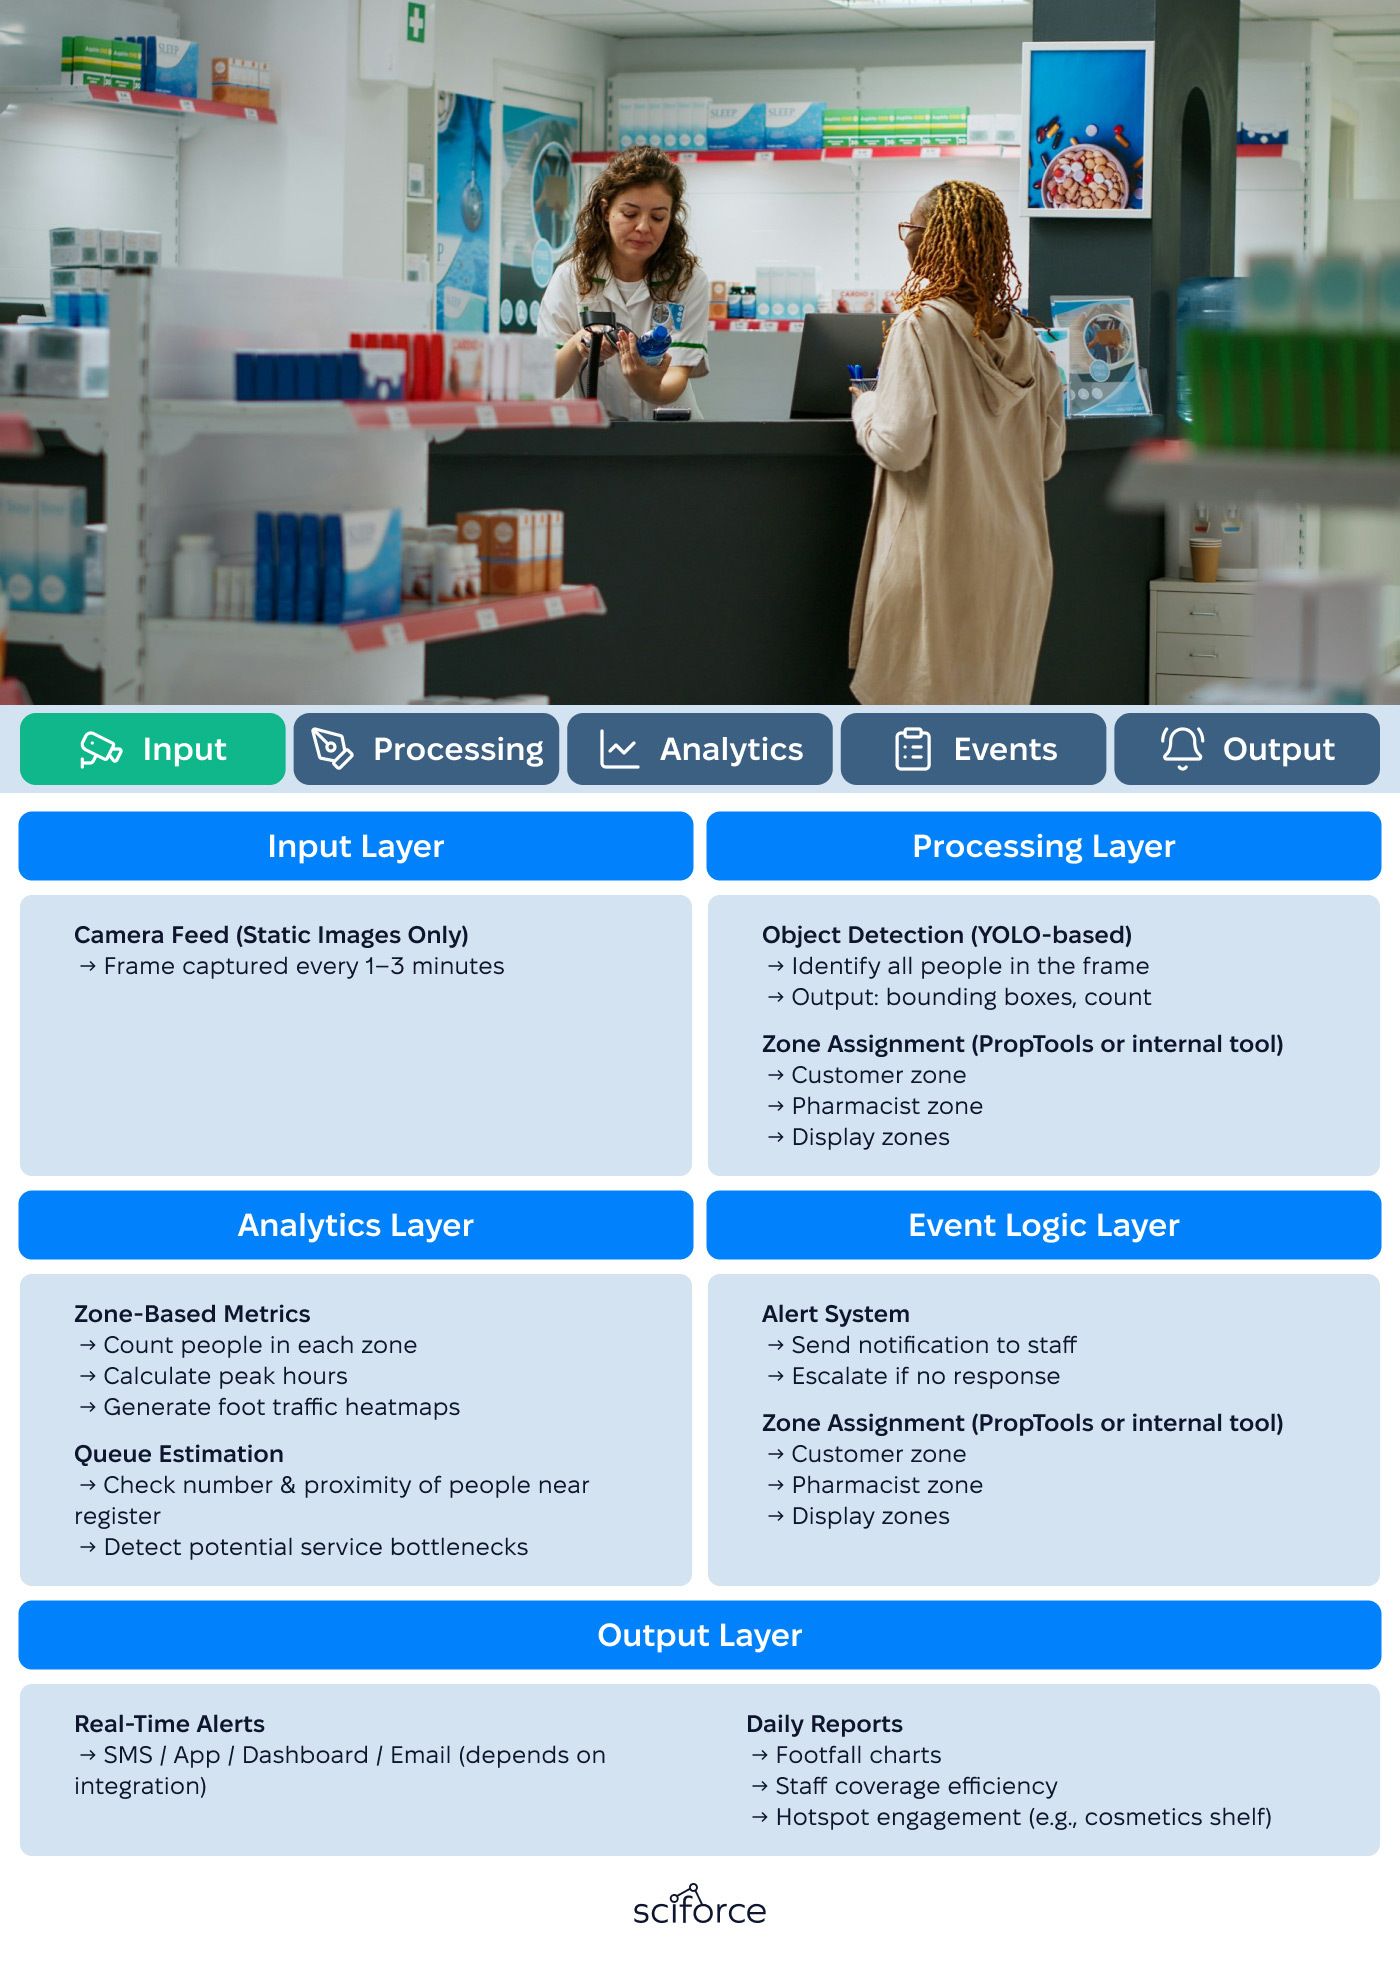
1) Object Detection (YOLO-based)
The solution applies YOLO-based people counting for small retail spaces, using interval-based image analysis instead of continuous video streams (e.g. every 1–3 minutes), avoiding the need for a continuous video stream and minimizing hardware and network load. By defining specific zones, such as the sales floor or behind the counter, it can reliably distinguish between customers and staff, enabling zone-based image analysis and event-based triggers.
2) Zone-Based Spatial Analysis
The solution uses zone-based computer vision for in-store analytics, dividing the pharmacy into functional areas such as entrance, counter, and product zones. It uses camera data to see where each person is and assigns them to one of these areas. This helps identify when someone is waiting at the counter, how many people are looking at specific shelves (like cosmetics), and whether a staff member is at the register when needed.
3) Queue Estimation via Spatial Proximity
The system checks how many people are standing near the counter and how close they are to each other. If three or more people are within 1–2 meters of the register, it counts as a queue. This logic demonstrates how to detect customer queues using object detection by analyzing proximity and density near the checkout area. No individual tracking of each person is necessary – just analyzing individual frames. If a pharmacy has more than one counter, a second camera can be added, but in most cases, one wide-angle camera is enough. For environments where full service cycle tracking is required, our restaurant monitoring case shows what that looks like across multi-zone dining areas with POS integration.
4) Event Triggering and Real-Time Notifications
The system uses AI camera analytics to identify situations like a customer arriving when no pharmacist is at the counter, or when more than six people are in the store. When this happens, it sends automatic alerts to staff. These alerts are based only on computer vision and zone detection—there’s no need to connect to cash registers or other sales systems.
5) Zone Heatmaps & Engagement Metrics
The system uses computer vision for staffing optimization to track how many people spend time in different parts of the store, like cosmetics stands, supplement shelves, or the checkout area. It creates visual heatmaps showing which areas get the most attention during the day — EyeAI, our space optimization product for retail and HoReCa, takes this further with real-time visitor trajectory sampling and queue progress management across larger store networks.
People Counting via Object Detection
The system uses object detection to count how many customers are in the store by checking snapshots from the camera taken every 30 to 60 seconds. It doesn’t need a full video stream, which makes it easier to run and less demanding on the equipment.
Zone-Based Presence Detection
The system splits the pharmacy into specific areas like the entrance, sales floor, checkout zone, and staff-only section. It uses low-latency image processing to count how many people are in each area. This helps tell the difference between staff and customers and supports features like queue alerts and activity tracking without needing to identify individuals.
Real-Time Queue Alerts
The system continuously analyzes visual data from designated zones and sends notifications when specific conditions are met:
Foot Traffic Statistics
This approach enables computer vision for customer flow analysis in pharmacies, producing time-based insights into store occupancy and peak service periods. These counts are aggregated into hourly and daily reports, highlighting peak periods (e.g. 11:00–13:00) and low-traffic windows.
Online vs. Walk-In Service Analysis
The system integrates with the pharmacy’s CRM-integrated analytics to distinguish between online order pickups and walk-in visits. By combining camera-based footfall data with order type records, it helps estimate how much traffic is driven by quick pickups versus in-store consultations, supporting better staffing and scheduling decisions.
Optional: Zone Heatmaps / Product Area Interaction
Using frame-by-frame analysis, the system monitors how many customers spend time in different sections of the store (e.g. cosmetics, supplements, medical devices). It aggregates this data for heatmap analytics for retail displays showing high-traffic areas over time.
Flexible Camera Setup
The system uses one or two cameras—typically covering the entrance and counter areas—and can work with existing surveillance systems. It captures periodic frames, minimizing hardware changes and making installation simple.
1. Initial Assessment and Planning
Deployment begins with a technical audit of each pharmacy’s layout, focusing on:
Most compact stores (<40 m²) can be covered with a single ceiling-mounted wide-angle IP camera (e.g., 2.8mm lens, 90–110° FOV). For dual-counter or segmented layouts, a second fixed-position camera may be added to monitor pharmacist areas.
Each camera is configured to capture static frames (e.g., JPEG over RTSP) at regular intervals, avoiding real-time video streaming. This minimizes compute load and supports deployment on lightweight edge-based AI deployment or client-managed servers.
With over 1,000 pharmacy sites, each location introduces distinct camera calibration variables—differing ceiling heights, lighting conditions, lens angles, and floorplans. To support scalable deployment, the retail computer vision solution is designed for flexible zone configuration, camera-agnostic input, and minimal manual tuning.
2. Camera Setup
Where possible, the system reuses existing IP-based surveillance infrastructure (RTSP-compatible), reducing installation time and hardware costs.
The setup supports flexible configuration across 1,000+ pharmacy sites with varying layouts, ceiling heights, and lighting conditions. At the opposite end of the scale, our warehouse tracking case shows the same YOLO-based detection applied to a single high-density fulfillment center processing thousands of orders daily.
3. Frame Capture and Object Detection
The system uses YOLO-based object detection system to process still frames captured from in-store cameras. It detects and counts all visible people, then classifies them as customers or staff based on their location within predefined zones (e.g., cashier area, sales floor, pharmacist station).
 4. Zone Definition
The camera view is divided into logical zones (e.g., entrance, cashier/pharmacist station, product display shelves) using the SciForce internal toolkit for zone-based analytics. This toolkit supports:
 5. Analytics Layer
The system counts how many people appear in each frame and tracks where they are in the store—such as at the entrance, near the cashier, or in certain product areas like cosmetics or supplements. This data is used to create reports showing how busy the store is at different times of day, which areas get the most attention, and when staff might need to be at the counter.
6. Real-Time Event Triggers
The system analyzes each captured frame using object detection and predefined zones (e.g. entrance, counter area). If a customer is detected at the entrance and no staff are visible behind the counter, it triggers a “no staff present” alert. If more than a set number of customers (e.g. 5) are present in the store or concentrated near the cashier area, it sends a crowding or queue alert. These notifications can be pushed to staff devices (e.g. phone, tablet, POS terminal) to prompt immediate action and reduce customer wait times.
7. Notification System
The notification system operates entirely on computer vision outputs, with no need for POS or CRM integration. Using YOLO-based object detection on periodic frames, it monitors activity in defined zones (e.g., customer area, pharmacist zone) and triggers AI-powered queue alerts when certain conditions are met.
Alert conditions include:
 All decisions are based on real-time zone presence. For example, if a customer is detected and no pharmacist is present, an alert is triggered. If multiple customers are detected and only one staff member is visible, a second notification can be sent.
Alerts can be delivered in several ways, depending on the pharmacy’s setup:
Real-time alerts reduce counter downtime by automatically notifying staff when queues form or no pharmacist is visible.
Automated footfall tracking provides hourly customer counts, helping optimize schedules without manual observation.
Heatmap data highlights where customers spend the most time, allowing targeted merchandising in high-traffic areas.