
Find out more with SciForce free mini guide
1. High-volume API-based ingestion
For some providers, API did not support file-based export, forcing all data – hundreds of thousands of records – to be fetched through direct API calls. This introduced several challenges: the high volume made bulk retrieval impractical, the lack of pagination documentation increased the risk of data gaps, and strict access limits required careful pacing. To ensure reliable ingestion, this constraint required scalable ETL for high-volume construction and infrastructure APIs.
2. Rate limiting and timeouts
Frequent timeouts and rigid rate limits on API made high-volume extraction unstable and prone to failure. Even short interruptions could compromise multi-day jobs. The main challenge was ensuring reliability under these unstable conditions. We had to build a system that could throttle requests, automatically retry failed calls, and recover from repeated API errors without restarting the process or losing previously collected data.
3. Inconsistent and fragmented source data
Providers delivered data in widely different formats – from flat, concatenated text strings to loosely structured multi-record formats. Key information like project details, company names, and contacts could appear bundled together or split inconsistently, much like in technical spec sheets, where OCR and NLP had to pull structured data from manufacturing documents with no consistent layout. The main challenge was building a pipeline flexible enough to parse, separate, and correctly associate these entities, while preserving data integrity across records.
4. Missing or incomplete fields
Many records lacked key details like project subtypes or precise locations, which limited filter accuracy and analytics. While internal rules and reference tables helped infer some values, unresolved gaps required flagging entries or reaching out to the client, slowing the process and increasing manual overhead.
5. Currency normalization
Budgets were reported in local currencies and based on historical contract or payment dates, not the processing date. This created a challenge for cross-region comparisons, as simple conversion at current rates would distort values. To address this, we applied currency normalization for international construction project costs using historical exchange rates aligned with each project's timeline. It required additional data sources and unstructured data transformation effort.
6. Hierarchical classification mapping
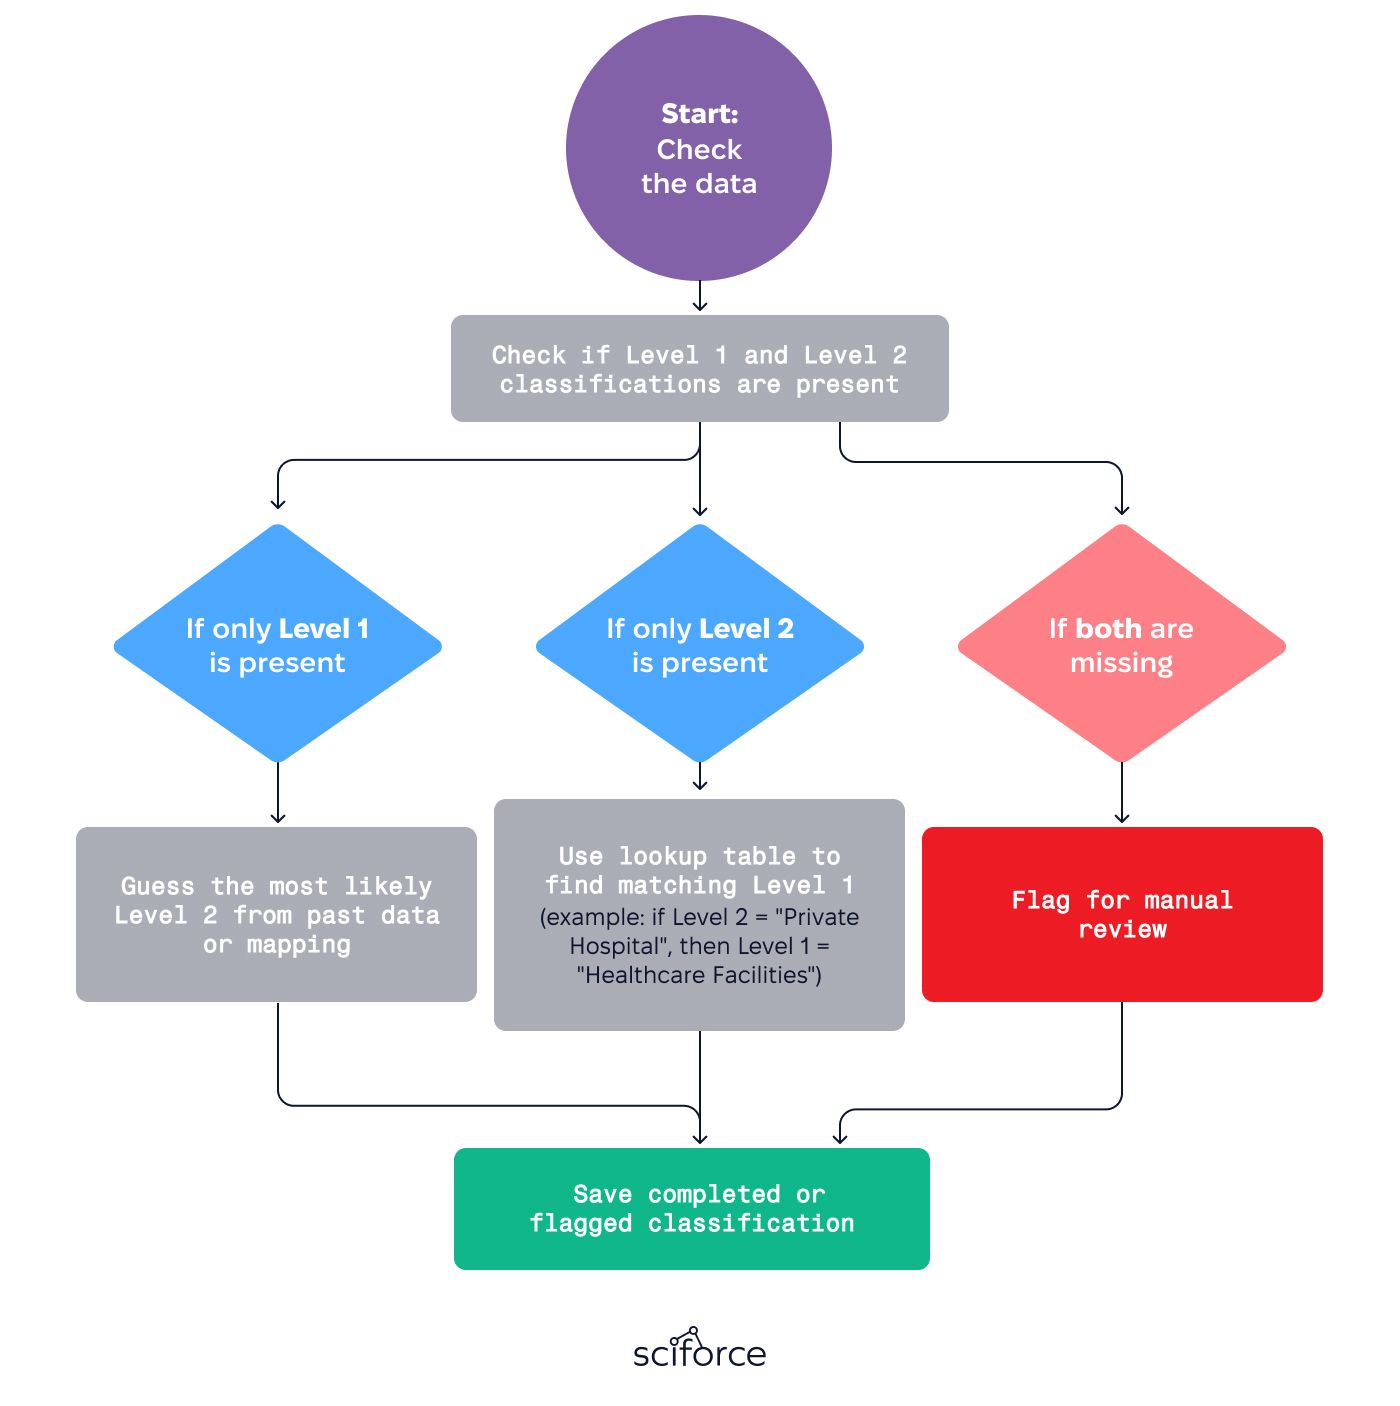
Project data often lacked consistency across classification levels. Sometimes only a broad category (like “education”) or only a specific subtype (like “primary school”) was provided, making it difficult to apply filters or analytics uniformly. The main challenge was ensuring all records conformed to the platform’s two-level classification system. This required custom logic to infer missing levels using lookup tables and validation rules, while flagging ambiguous cases for manual review.
7. Multiple record linking
Entities like contractors or contact persons often appeared under inconsistent names (e.g., “ABC Ltd” vs “ABC Limited”). This risked fragmenting the data and skewing analytics. To resolve it, we applied entity resolution and deduplication, using fuzzy matching, normalization rules, and selective manual checks to merge duplicates and maintain accurate relationships across records.
1) Multi-source data intergration
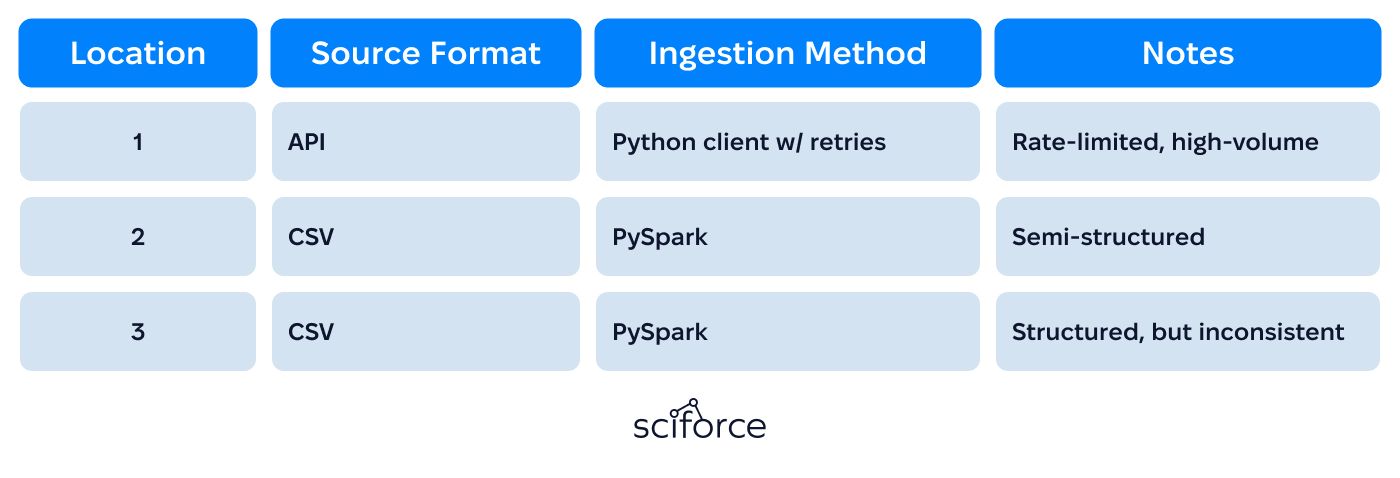 Data came from providers in different countries, each using different formats, requiring data engineering for PropTech platforms with multiple providers. One provider used a high-volume API, requiring a custom Python client with retry logic and checkpointing. CSV files from other sources were processed using PySpark.
2) Standardized ETL pipeline on Palantir Foundry
During transformation, the team applied consistent naming conventions, converted currencies, standardized project timelines, and mapped data to a shared schema, forming a robust data validation and enrichment pipeline for downstream analytics — the same AI-driven data standardization discipline underpins our PCORnet ETL pipeline on Snowflake, where heterogeneous clinical feeds from multiple hospitals are harmonized into a conformant CDM.
Final outputs were written into structured Foundry tables used by downstream visualization apps and real estate and infrastructure analytics.
3) Data transformation and enrichment
After collecting the raw data, the automated data cleaning system cleaned, normalized, and enriched it to ensure consistency across providers and readiness for analytics. Key steps included:
- Standardizing field names: Mapped different labels to a shared schema. For example, “Builder” and “ContractorName” were both treated as the same field.
- Filling missing values: Applied inference rules to complete partial data. If only a detailed project type (e.g. “private hospital”) was present, the broader category (“healthcare facilities”) was auto-filled.
- Geographic enrichment: Added standardized country, region, and city codes using external reference datasets. Estimated latitude and longitude based on location text when coordinates were not provided.
- Currency normalization: Converted all project costs to euros using historical exchange rates based on the project’s start or payment date.
4) Handling incomplete data
We worked with a two-level classification system for both project types and geographic locations. For example:
Project types: Level 1 might be "Healthcare Facilities", while Level 2 could be "Private Hospital" or "Emergency Room"
Geographic units: Level 1 could refer to a province or state, and Level 2 to a specific city or municipality
When only one level was available in the raw data, we used rule-based logic to infer the missing level. For instance, if a record listed "Private Hospital" (Level 2) but not "Healthcare Facilities" (Level 1), we added it automatically. If the inference was ambiguous or impossible, we flagged the record and requested clarification from the client. This ensured that all records followed a unified classification structure used across the platform.
5) Entity resolution and relationship mapping
We consolidated duplicates through entity resolution, ensuring each project, company, and contact appeared only once in the final dataset. This preserved accurate links between entities and supported clean, reliable analytics across records.
6) Output format
The final dataset included key details like project name, type, client, contractor, cost in euros, timeline, and location codes (country, region, city), all formatted in a consistent way across providers. As a result, the platform illustrates how to build filterable construction intelligence from raw data feeds inside a client-facing web application.
Once the data was cleaned and standardized, a separate team added business metrics – such as how many projects a contractor handled in a region or average project size. The full dataset made available in a web app, where clients could explore it using filters, tables, and maps – a foundation for delivering AI-driven insights for developers and contractors.
Unified international dataset
Access project data from different locations in a single, standardized format. Key fields – such as project type, timeline, cost (in euros), and location codes – are mapped to a shared schema, enabling consistent filtering, comparison, and analytics across sources.
Standardized terminology and labels
Field names and value formats from different sources are mapped to a unified schema. For instance, roles like “Builder,” “ContractorName,” and “Executor” are standardized under one “Contractor” field. Location formats and project categories are also normalized, enabling consistent filtering, data aggregation and harmonization, and cross-country comparisons.
Two-level classification for projects and locations
Each project and location entry includes both a high-level category and a specific subtype, pre-assigned during processing. This enables users to instantly filter, sort, or group data by sector (e.g. “Transport”, “Health”) or administrative unit (e.g. “Province”, “Municipality”) without needing to manually classify or interpret raw input values.
Currency conversion by project date
Each project’s budget is shown in euros, converted using the exchange rate active at the time of contract signing or payment. This ensures that users can accurately compare costs across countries and years – no need to adjust for inflation or track down conversion dates manually.
Multi-level location data
Projects are tagged with structured location metadata – country, region, city – standardized across all sources. When coordinates are missing, they’re estimated from textual fields. This enables users to filter, group, or map data by any geographic level.
Consistent field labels for cross-country filtering
Apply the same filters across all countries without extra setup. Fields like contractor, project type, status, and timeline are automatically mapped to a unified schema – so “Builder,” “ContractorName,” and similar variants are treated as a single, consistent field. This allows quick filtering, grouping, and reporting across sources.
Analytics-ready datasets
Each record is cleaned, enriched, and checked during processing. Missing values (like location codes or project categories) are auto-filled using reference rules, while ambiguous entries are flagged for review instead of being excluded. The result: a complete dataset that’s ready for dashboards, filters, and KPI tracking without extra cleanup.
Interactive web access
Access project data through an interactive web app with configurable tables, dropdown filters, and map-based visualizations. Users can filter by region, contractor, project type, or timeline, and view results instantly – no SQL or scripting needed.
1. Source Integration
 Data was ingested from multiple international providers using provider-specific methods. For the one of the partners, we developed a custom Python API client that handled unstable connections through rate-limiting, automatic retries, and checkpointing – critical for multi-day extractions. For other sources, we ingested large CSV files using PySpark to ensure efficient parsing and scalability. All inputs were ingested into Palantir Foundry in raw form, preserving original structure for traceability and staged processing.
2. Entity Extraction
Once the data was ingested, we broke it down into clearly defined parts — separating entities from inconsistent source formats is something we've also done for legal documents, where NLP extracted clauses and parties from agreements with varying structures. This involved:
This step ensured that each piece of information could be processed, enriched, and used accurately in the system.
3. Data Staging
We organized the pipeline into three well-defined stages to ensure clear data flow and traceability:
Each record retained a lineage ID to trace transformations back to the source, simplifying error resolution and quality control during later stages.
4. Field Normalization
We mapped inconsistent field labels from different sources – such as “Builder,” “Executor,” and “ContractorName” – to a unified “Contractor” field. Project timelines were reformatted into a consistent start–end structure, and location fields were standardized using region and city code tables. Delta logic was implemented to identify and apply incremental updates, reducing processing load. The process also removed structural duplicates and flagged mismatches in data types or missing critical fields for manual review.
5. Data Enrichment
To prepare the dataset for analysis, we enriched raw records with structured geographic, financial, and categorical information. Location fields were cleaned and mapped to standardized country, region, and city codes using internal reference tables. When GPS coordinates were missing, we estimated them based on place names to support map-based visualizations.
Project budgets were converted to euros using historical exchange rates aligned with the actual payment or contract dates – avoiding distortions from real-time currency values. We also filled in missing classification levels (e.g., sector or subtype) using inference logic, ensuring each record could be grouped and filtered consistently across the platform.
6. Final Structuring
The finalized dataset was written into Foundry-native tables, structured to support both internal analytics and external client access. These tables were optimized for use in dashboards, filters, and KPI modules, with standardized field formats and joinable keys. Full tracking was maintained, allowing teams to audit each transformation step – from raw ingestion to final output – ensuring transparency and ease of debugging.
Most entries now include both top-level and subtype classifications for project types and locations, supporting detailed segmentation.
Where GPS coordinates were missing, location strings were mapped to approximate coordinates to support map-based analytics.
Entity resolution logic successfully identified and merged variations in company and contact names, minimizing fragmentation in reporting.
Automated inference and anomaly flagging reduced manual review time by approximately 40–50%, allowing faster delivery cycles without compromising data quality.
Cleaned and structured outputs are published to client-facing dashboards on a regular cadence, with field names and formats ready for direct use in metrics and reporting.