Find out more with SciForce free checklist
1. Cloud Obstruction in Satellite Images
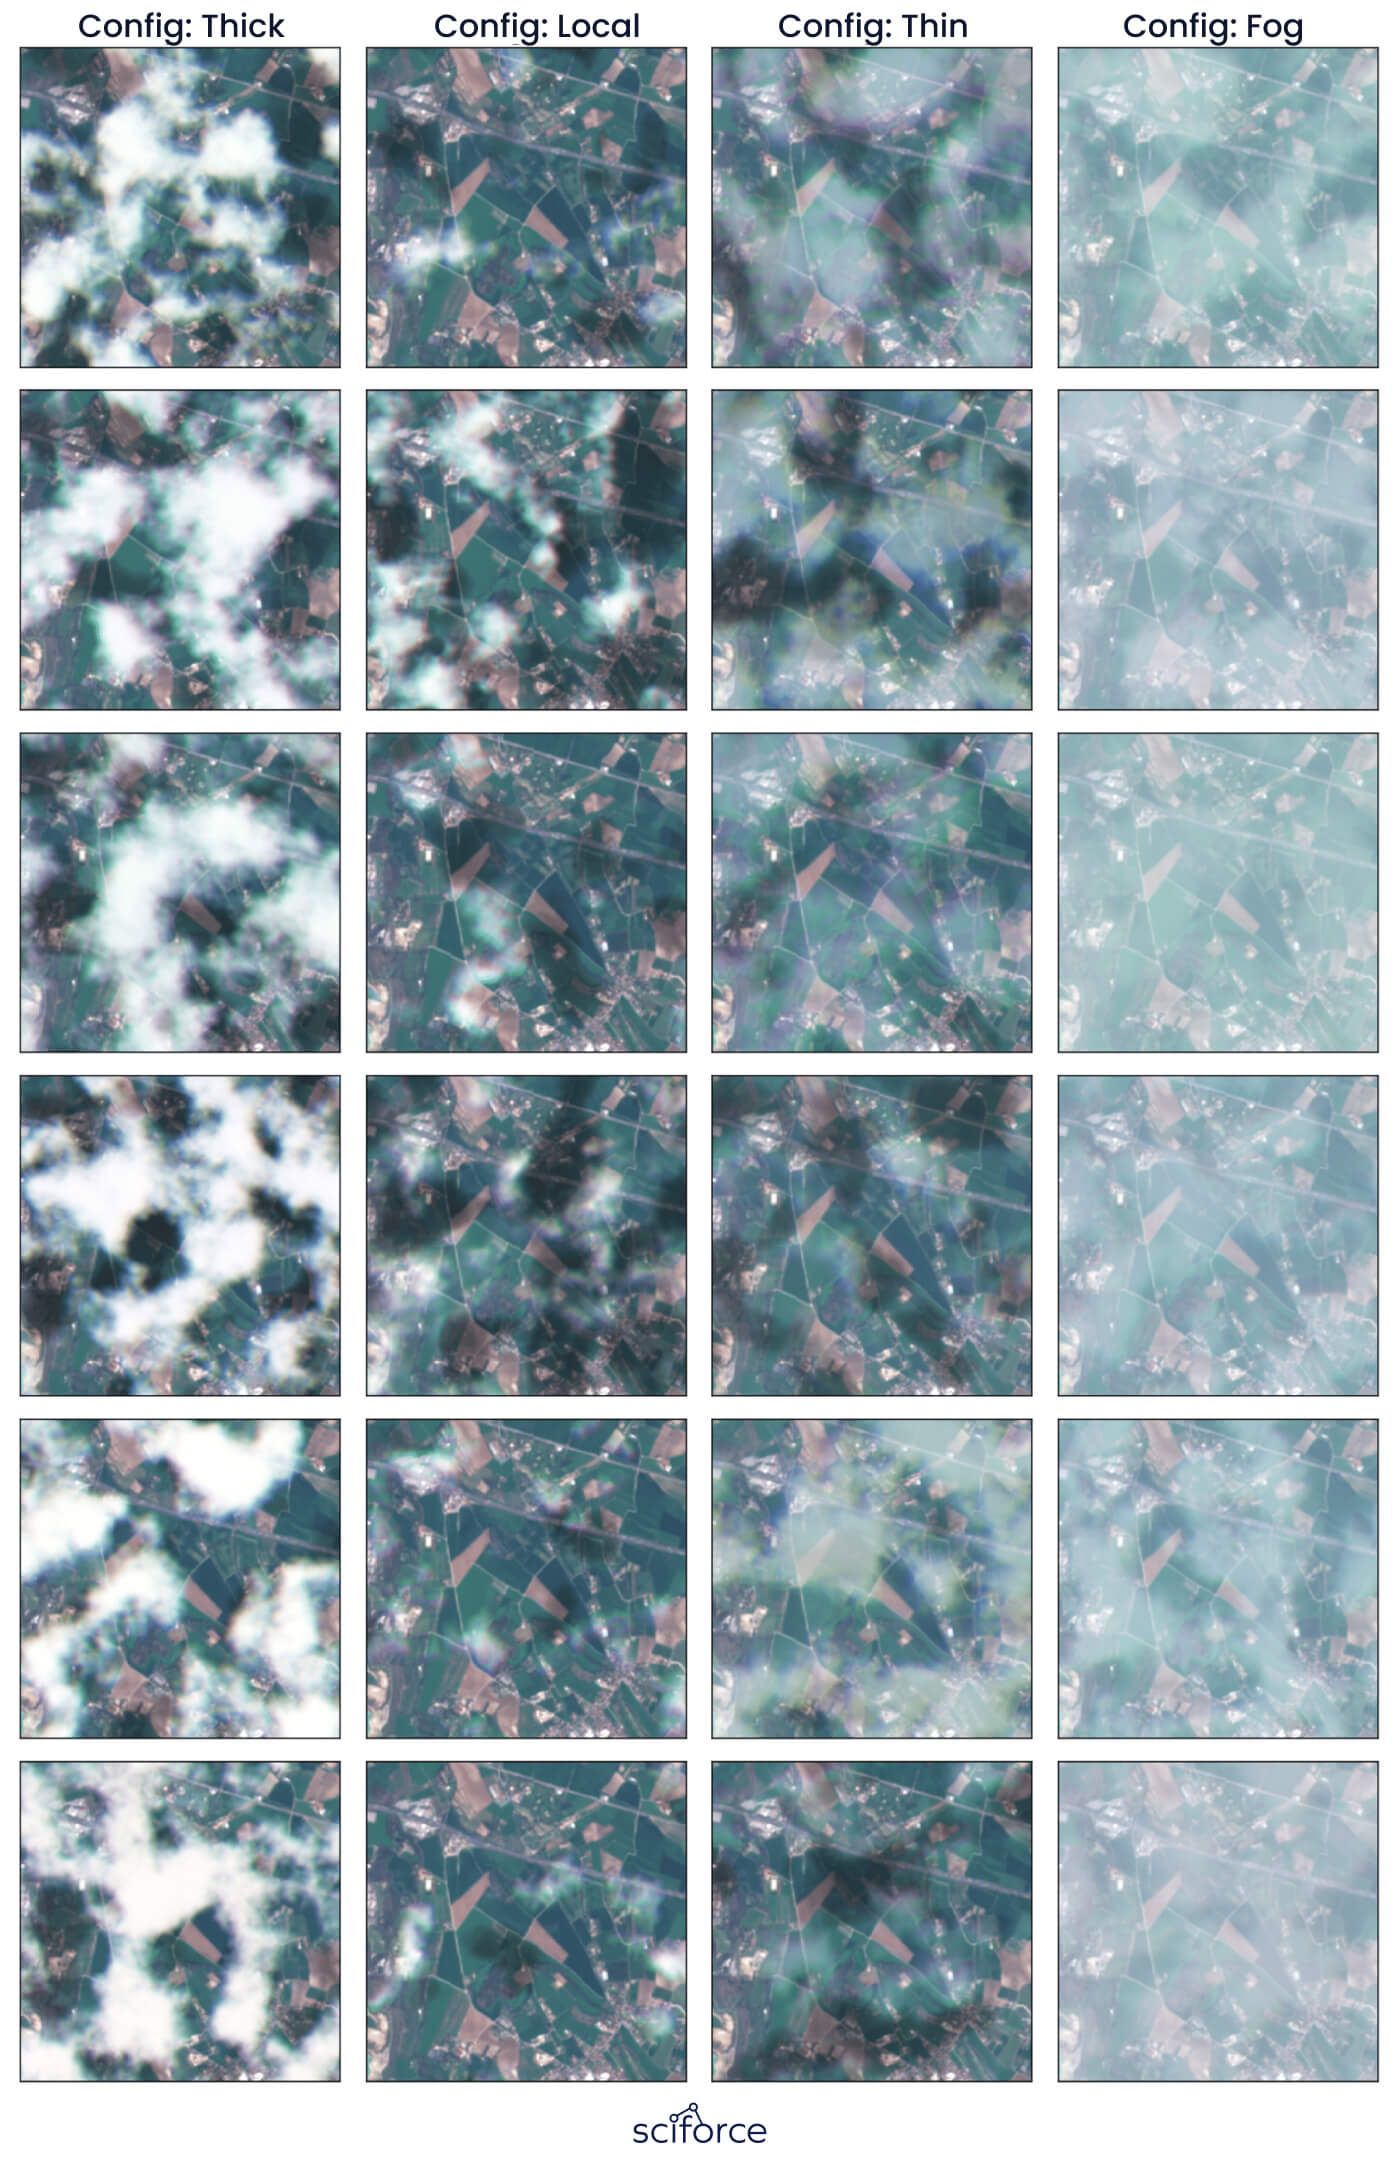
During critical growth stages, such as flowering or early fruiting, cloud cover lasting up to 30–60 days often blocked satellite views, preventing the capture of essential data on crop health, moisture levels, and growth progress. These interruptions created significant gaps in data, limiting client’s ability to provide accurate, timely predictions for crop yield and harvest readiness.
2. Small and Incomplete Client Datasets
The client had to predict crop yield with limited agricultural datasets, covering only small, localized areas (e.g., 20 fields from a single region), making crop it difficult to generalize. This lack of diversity is a common issue in AI in agriculture making it challenging to generalize predictions, such as crop yield or sugar content, to larger regions or varied conditions. The limited ground-truth data, such as lab-measured sugar levels, made it difficult to validate and refine the models for sugar content predictions.
3. Difficulty in Predicting Sugar Contents
AI-based sugar content prediction in crops, particularly sugarcane, was challenging due to weak correlation between visual indices like plant greenness (NDVI) and actual sugar levels. This required complex modeling to estimate sugar content, but the lack of ground-truth data, such as laboratory-measured sugar content from the fields, made it difficult to validate and refine the models.
4. Heavy Reliance on External Metadata
To improve prediction accuracy, the client depended on extra data like plant variety, soil type, and weather conditions. However, this information was often incomplete, inconsistent, or not standardized across different regions. The lack of consistency made it harder to use this data in the prediction models, complicating the process and making the crop yield and sugar content forecasts less reliable.
5. Radio Wave Data Interpretation
While radar imagery from Sentinel-1 and Sentinel-2 helped capture data during cloudy periods, interpreting radio wave data (SAR) proved challenging. Unlike optical images, radio wave signals had to be decoded to understand what they represented in terms of crop health and field conditions, requiring additional model adjustments.
1) Interpolating Missing Data
To address cloud cover blocking satellite images, we used interpolation techniques to estimate missing data by analyzing the nearest available clear images from before and after the cloud-covered period. This was combined with radio wave data from Sentinel to fill in gaps where optical images were unavailable.
2) Incorporating External Metadata
We integrated specific external data, including plant variety (e.g., sugarcane strains with varying sugar content), soil types (such as loamy or sandy soils), and detailed weather patterns (rainfall, temperature, and sunlight exposure) into the models.
3) Using Agro-Indices
The team used NDVI (Normalized Difference Vegetation Index) and other indices for multi-spectral image processing such as VARI (Visible Atmospherically Resistant Index), and EVI (Enhanced Vegetation Index) to track plant health and growth. These indices measured how crops reflected light in the visible and infrared spectrums, which was critical for understanding plant stress and growth progress, even when optical satellite images were partially obstructed or unavailable.
4) Adding Alternative Data Sources
We used cloud-penetrating radar (SAR) analytics for agriculture from satellite sources like Sentinel. Unlike optical satellites, radar can penetrate cloud cover, providing reliable data on crop conditions even during prolonged cloudy periods.
5) Geospatial Data Processing:
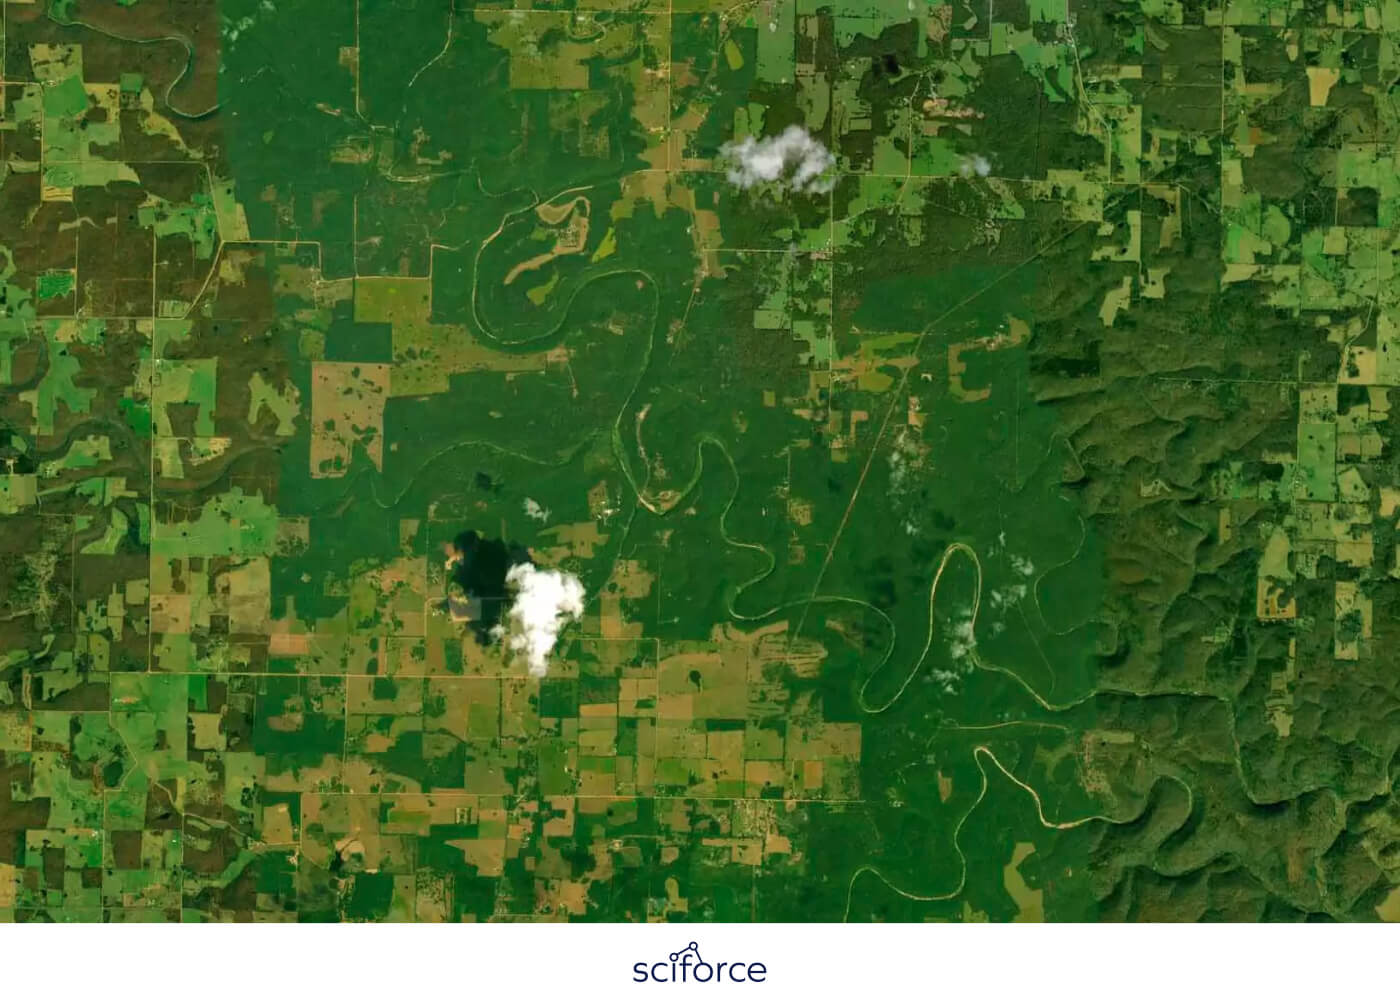
The smart farming platform utilizes tools like Geopandas to efficiently manage and analyze large sets of geospatial data, including field boundaries, elevation models, and soil maps. This enables precise mapping and analysis of regional agricultural conditions, such as soil quality variations, crop distribution, and topographical influences on water flow, supporting ongoing digital transformation in agriculture.
Satellite and Drone Imagery Integration
The platform combines satellite images from Sentinel with high-resolution drone photos to monitor large farms. This provides wide coverage and detailed insights into crop health, soil conditions, pests, and irrigation needs, helping track harvest readiness and field conditions efficiently. What changes when you point the same drone cameras at rooftops instead of fields is documented in our roof damage assessment case.
Agro-Index Calculation
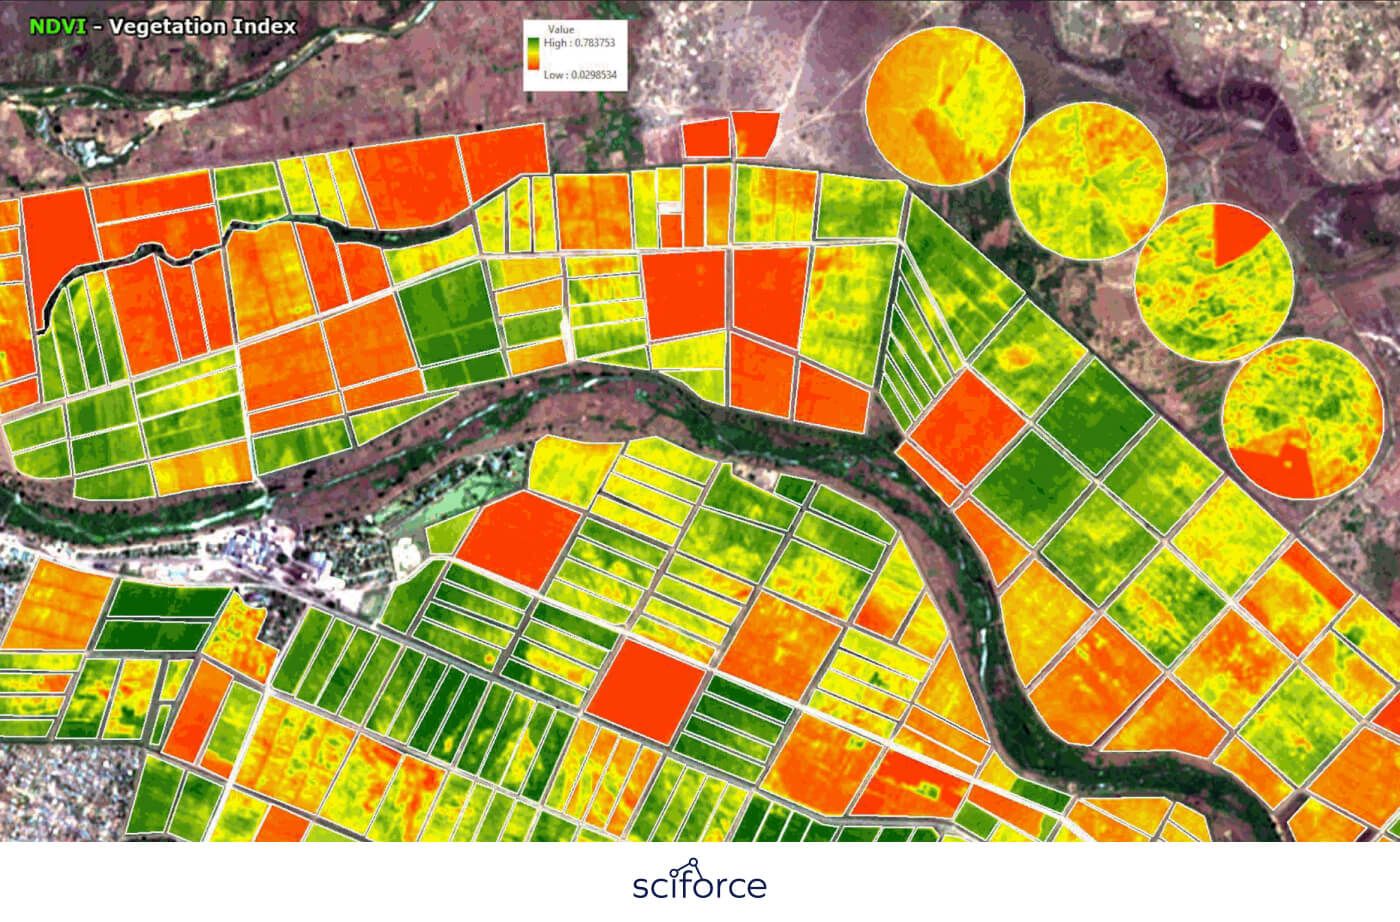
The platform supports agro-indices like NDVI (Normalized Difference Vegetation Index), VARI, and EVI which assess crop health by analyzing how plants reflect light in visible and infrared wavelengths. For instance, NDVI measures the difference between near-infrared light, which healthy plants reflect, and red light, which they absorb, to gauge plant health.
Multi-Source Data Input
The platform accepts and processes diverse external data, including specific soil types (e.g., sandy, loamy, or clay), plant varieties (e.g., different strains of sugarcane or wheat), and detailed weather conditions (e.g., rainfall, temperature, and humidity). By combining this metadata with satellite and drone imagery, the platform improves the accuracy of predictions for crop yield, plant health, pest risks, and irrigation needs.
Cloud-Penetrating Radar Imagery
The platform uses radar-based imagery from sources like Sentinel, which employs Synthetic Aperture Radar (SAR) technology. This allows data collection through cloud cover and during adverse weather conditions, such as heavy rain or fog, ensuring continuous real-time field monitoring of crop conditions, soil moisture levels, and field structure without interruptions caused by weather.
Weed Detection Algorithms
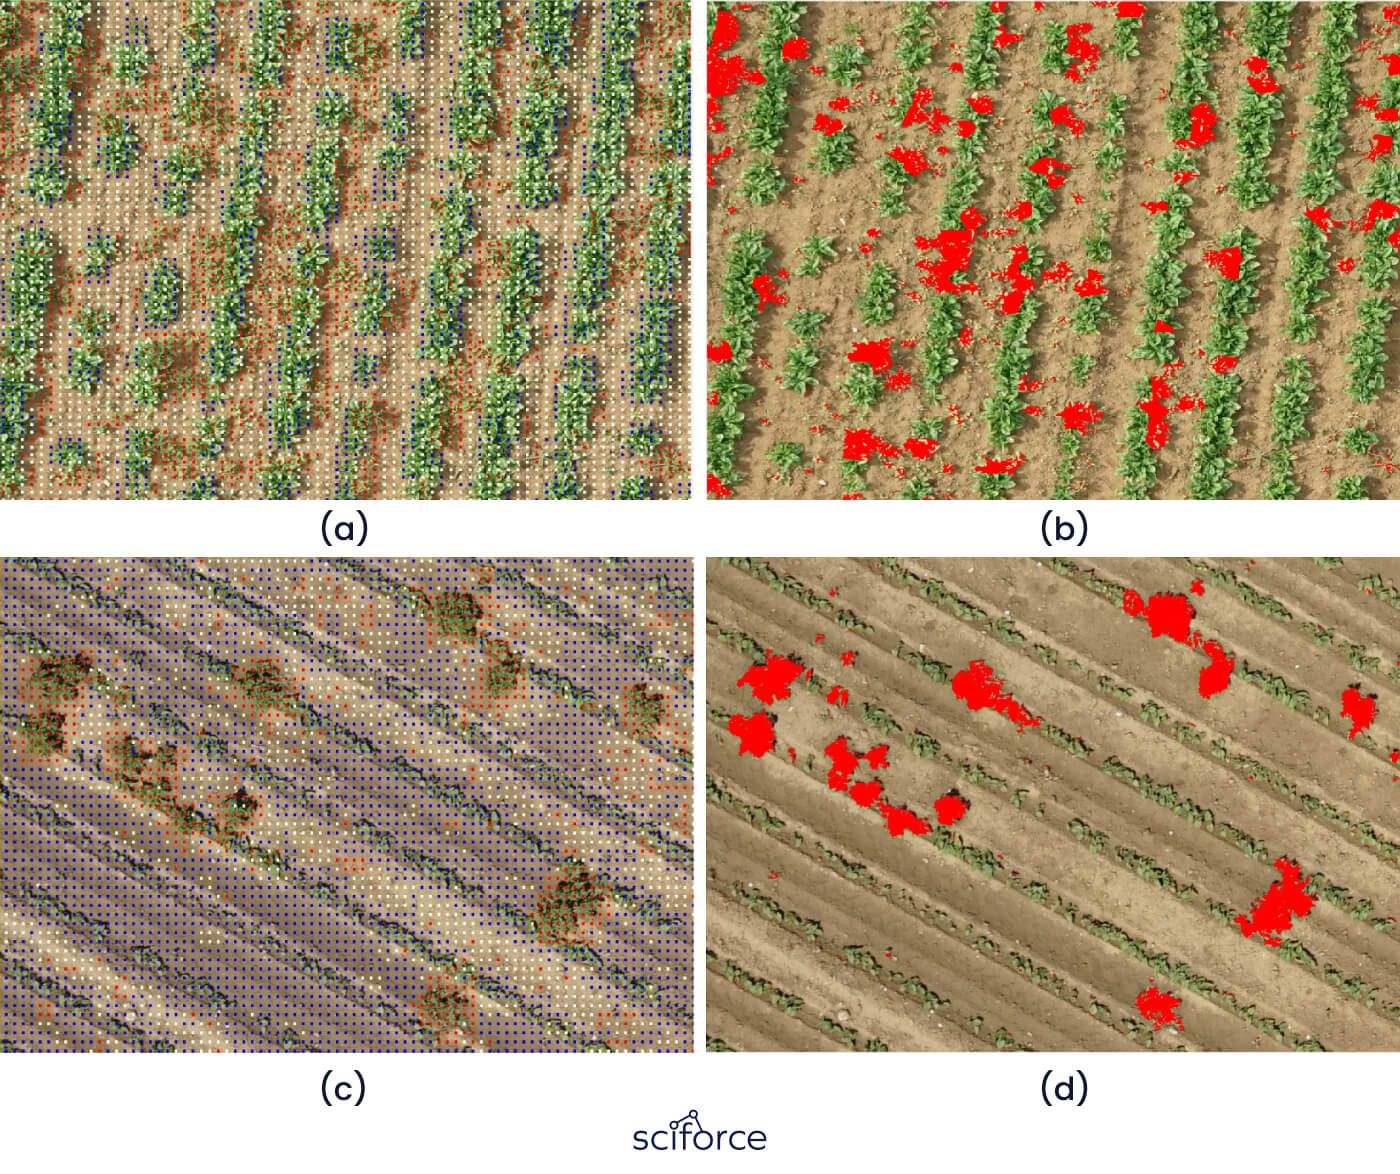
To enhance crop monitoring accuracy, we developed models to detect weeds, which have different growth cycles from sugarcane. Using computer vision for crop health and weed detection, including CNN and LSTM models, the system distinguishes weeds from crops in satellite imagery. This capability allowed farmers to act quickly, improving crop health and yield predictions by reducing competition between weeds and crops.
Sugar Content Analysis and Prediction
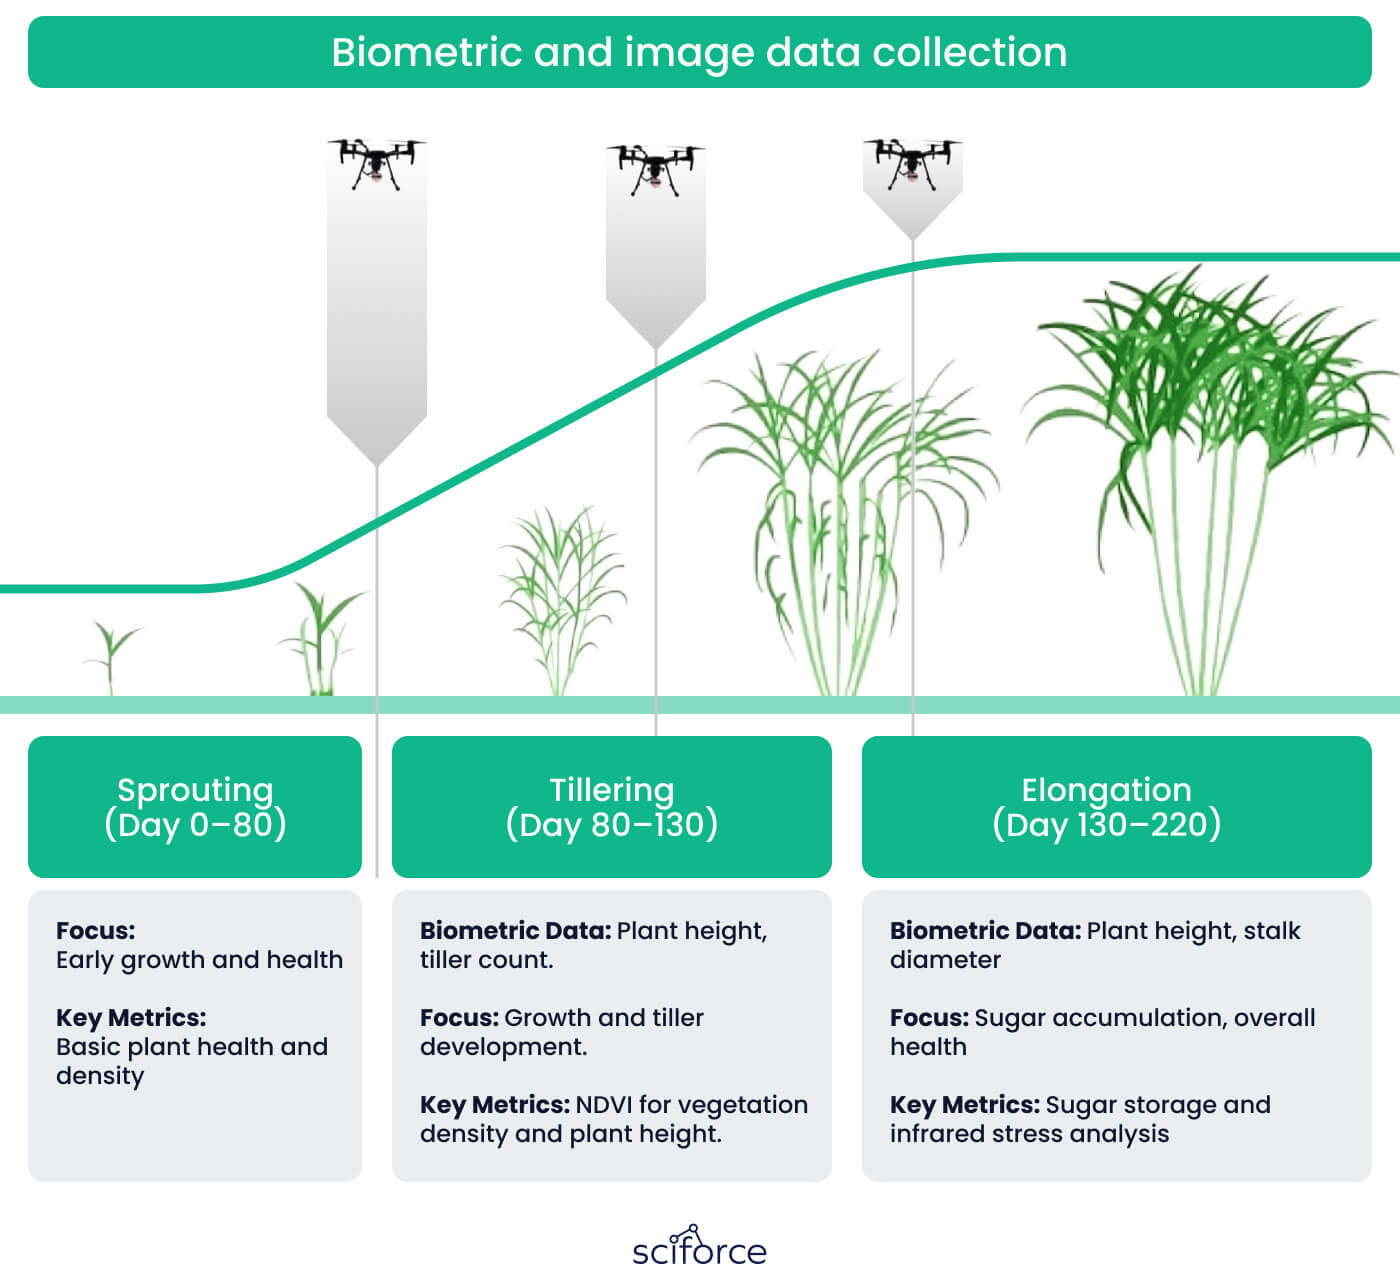
The platform offers tools to analyze and predict sugar content in crops like sugarcane. By using agro-indices like NDVI and combining them with data such as plant variety, soil type, and weather conditions, the platform estimates sugar levels based on crop health and growth.
Field Zoning and Data-Driven Farm Management
The platform enables farmers to create custom field zones based on soil quality, crop type, and moisture levels. This feature supports precision farming techniques by allowing farmers to tailor treatments such as fertilization, irrigation, and pest control to specific zones, maximizing efficiency and reducing costs.
1. Initial Setup and Data Integration
The project started with integrating satellite imagery from sources like Sentinel and Planet. This imagery provided the foundation for crop monitoring, enabling us to gather data on field conditions, crop growth, and yield predictions. We designed a system to handle multiple data types, ensuring smooth ingestion of satellite and external metadata.
2. Implementation of Agro-Indices
Our team incorporated agro-indices such as NDVI, VARI, and EVI into the platform early in the development. These indices were critical for tracking plant health by analyzing spectral data, including near-infrared and visible light, allowing the system to gauge plant growth, stress levels, and overall field health throughout the growing season.
3. Model Development and Testing
We developed and tested several machine learning models, including YGB (Gradient Boosting), CNN, and LSTM. These models were trained to differentiate between crops and weeds, predict crop yields, and estimate sugar content in sugarcane. The models underwent iterative refinement to improve their accuracy and adaptability to varying conditions.
4. Data Preprocessing and Geospatial Management
Handling large amounts of geospatial data was a key part of the process. We used tools like Geopandas to manage and process data from different regions, creating detailed maps and spatial data representations. This provided the foundation for analyzing trends across different fields and regions efficiently.
5. Interfacing with External Data Sources
To enhance predictions, we integrated external data such as weather patterns, soil types, and plant varieties. This required building a flexible data model capable of ingesting, processing, and combining these multiple data streams with satellite imagery to produce richer and more informed predictions.
Machine Learning Models:
YGB (Gradient Boosting), LightGBM, and Linear Models for crop yield prediction, weed detection, and sugar content estimation.
Deep Learning Models:
CNN (Convolutional Neural Networks), LSTM (Long Short-Term Memory), and Transformers for advanced crop health analysis and weed detection.
Agro-Indices:
Supports NDVI, VARI, and EVI for real-time monitoring of crop health and growth. Geospatial Data Management: Powered by Geopandas for handling large-scale field data, soil maps, and topography.
Cloud-Penetrating Radar Imaging:
Uses Synthetic Aperture Radar (SAR) from Sentinel and Planet for uninterrupted data collection in all weather conditions.
Using interpolation techniques and radar-based images from Sentinel-1, the platform reduced gaps in data caused by cloud cover. This improvement provided more consistent and detailed crop health insights, leading to a 30% boost in overall data accuracy.
By integrating agro-indices like NDVI, which tracks plant health, with detailed external data such as soil type (e.g., sandy or loamy soils), weather patterns (rainfall, temperature), and plant variety, the platform enhanced the precision of crop yield forecasts by 25%.
With the help of CNN and LSTM models, the platform sped up weed detection by 40%, allowing farmers to respond more quickly, reduce nutrient competition, and improve crop health.
By integrating agro-indices like NDVI with external data such as plant variety, soil type, and weather conditions, the platform increased the accuracy of sugar content predictions by 20%. This enabled farmers to better optimize harvest timing, resulting in an increase of actual sugar content by 12-15%.
The improvements in data accuracy, crop prediction, and weed detection resulted in a significant increase in overall yields, estimated at around 15-20%. This was possible, because farmers had the opportunity to make better-informed decisions and use resources more efficiently.
By blending satellite imagery, radar data, and smart machine learning for crop analysis, the platform takes AI farming solutions to the next level. Ready to turn data into better harvests? Book a free consultation now!