
DevOps metrics are no longer limited to engineering teams. In 2026, they directly affect costs, delivery speed, and business risk.
The financial impact of failure makes this clear. New Relic’s 2025 Observability Forecast shows that high-impact IT outages carry a median cost of $2 million per hour, or more than $33,000 per minute. The median annual cost of such outages reaches $76 million per organization.
Find out more with SciForce free whitepaper
When downtime carries this level of cost, the metrics used to guide delivery and operations stop being technical details and start shaping financial outcomes. This exposes a gap in how DevOps is often measured. Metrics like commits, builds, or tickets closed say little about system resilience, recovery speed, or the true cost of failure. What matters instead is how quickly changes can be delivered safely, how fast incidents are detected and resolved, and how reliably systems operate under load.
In 2026, the DevOps metrics that matter are the ones that connect speed, reliability, and cost efficiency to real business outcomes. This article explains which metrics belong on that list — and which ones don’t.
The way DevOps metrics have changed reflects a shift in cost and risk, not in tools or workflows.
Flexera’s 2025 State of the Cloud Report shows that 84% of organizations struggle with cloud cost management, while 50% already run generative AI workloads in the cloud. These workloads scale fast, rely on expensive infrastructure, and increase the financial impact of inefficient delivery and system instability.
This changes what DevOps decisions mean in practice. Cloud and AI environments can grow instantly, and small inefficiencies or failures quickly turn into higher costs and broader risk.
As a result, DevOps outcomes now have direct financial consequences:
In this environment, activity-based metrics lose their value. Counts of commits, builds, or tickets completed show effort, not results. They don’t explain whether delivery is improving, systems are becoming more stable, or costs are under control.
Modern DevOps metrics focus on outcomes instead:
These metrics make delivery speed, reliability, and cost visible at the same time — and set the direction for the sections that follow.
Modern DevOps metrics fall into three groups that show how software delivery creates and protects value. They measure how fast ideas reach production, how reliably systems operate, and how efficiently infrastructure spend is used.
These groups are based on widely used industry approaches, including DORA metrics for delivery performance, reliability measures from SRE practices, rather than internal activity counts.
Together, these metrics show whether DevOps is improving real outcomes. The sections below focus on the measures that consistently relate to delivery speed, system stability, and cost control.
Speed metrics show how quickly changes move from code to production. In the DORA framework, speed is measured through deployment frequency and lead time for changes, which reflect how efficiently work flows through delivery. Delays matter because slower delivery pushes feedback out, raises risk, and postpones value.
1.1 Deployment Frequency (DORA metric)
Deployment frequency measures how often an organization releases code to production. Higher deployment frequency usually reflects a delivery process built around small, incremental changes rather than large, infrequent releases:
Frequent deployments also reduce the time between implementation and real-world feedback:
Deployment frequency ultimately reflects how quickly an organization can respond to demand and adapt to change.
1.2 Lead Time for Changes (DORA metric)
Lead time for changes measures how long it takes for a code change to move from commit to production.
Short lead times indicate an efficient delivery pipeline with minimal friction. Long lead times signal growing coordination overhead and higher cost of delay:
As lead time increases, even small changes accumulate into larger, riskier releases. This raises the likelihood of failures and increases recovery effort.
Among DevOps metrics, lead time is one of the clearest indicators of delivery efficiency. Reducing lead time improves responsiveness, lowers coordination costs, and enables faster iteration without sacrificing control.
Reliability metrics describe how safely changes are introduced and how systems behave under failure. They capture how often changes fail, how quickly services recover, and how consistently systems remain available over time.
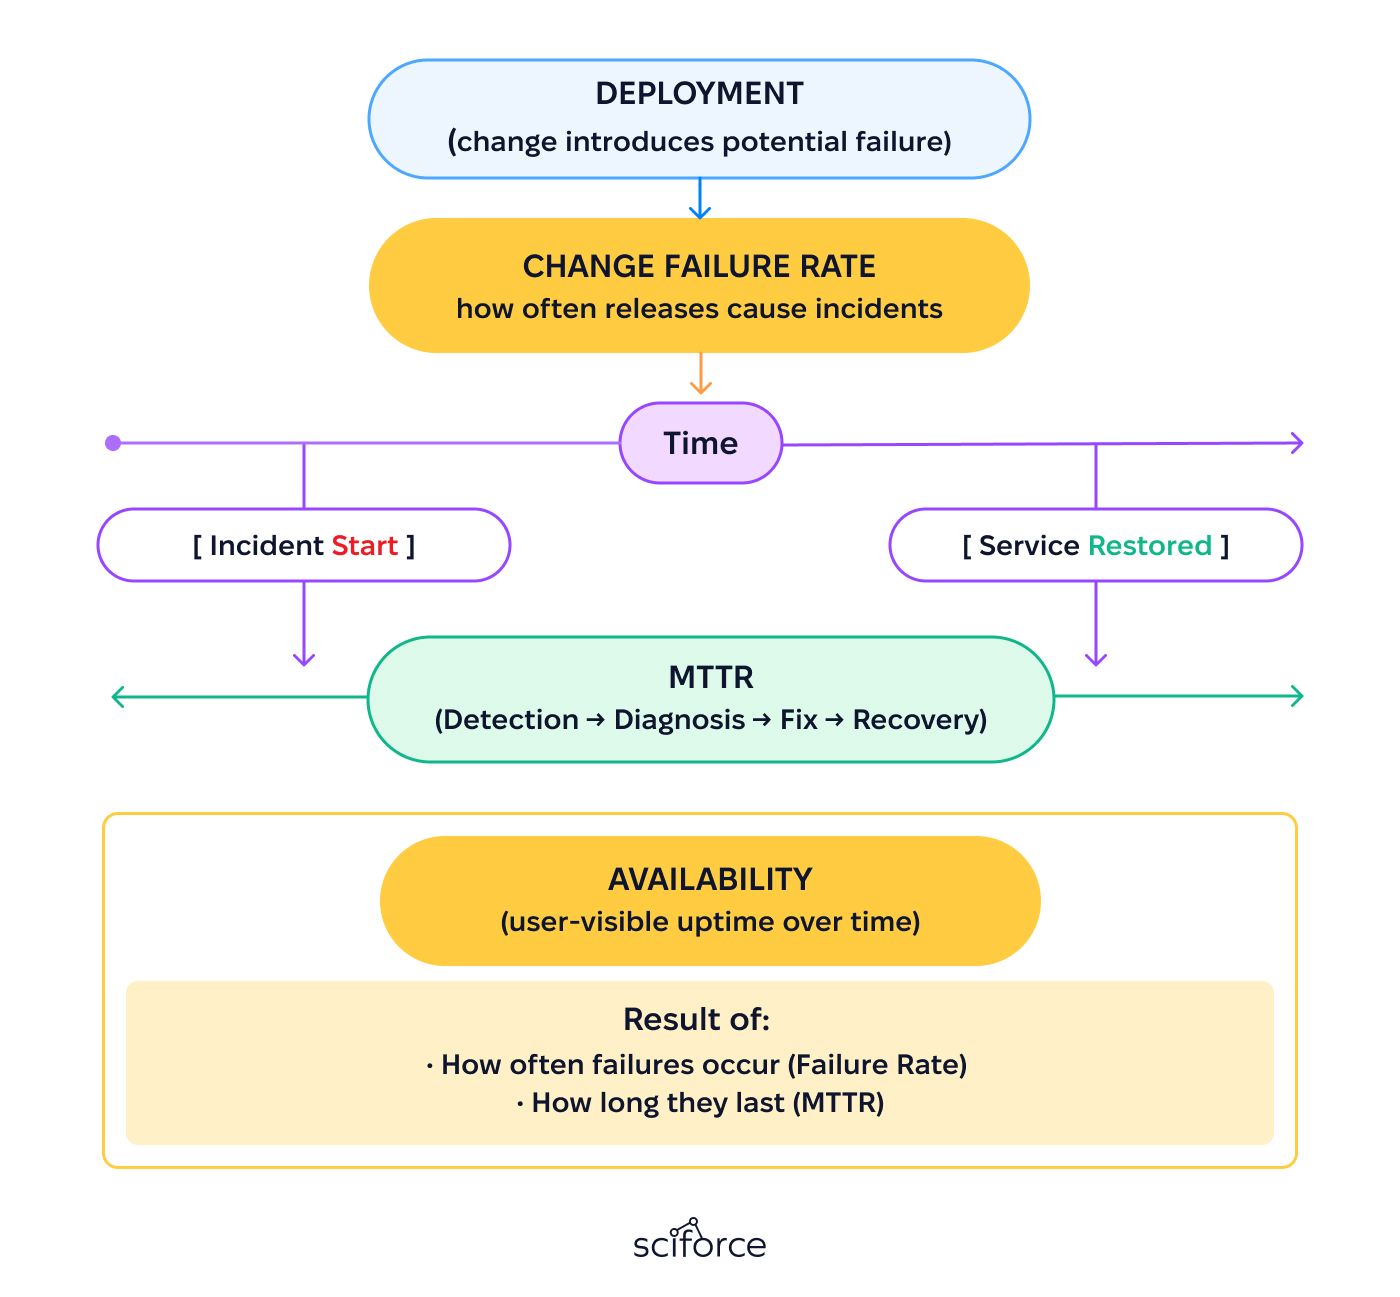
2.1 Change Failure Rate (DORA metric)
Change failure rate measures how often deployments lead to incidents, rollbacks, or degraded service.
A low change failure rate suggests stable releases and effective checks before deployment. When the rate increases, it signals higher risk, even if changes are delivered quickly:
High deployment frequency alone does not reduce risk. If the change failure rate is high, delivery becomes less predictable and downtime exposure increases.
2.2 Mean Time to Restore (DORA metric)
Mean Time to Restore (MTTR) measures how quickly service is restored after an incident. Since failures are inevitable in complex systems, recovery speed often matters more than avoiding every failure. Lower MTTR limits the impact of outages by:
Improvements in monitoring, alerting, incident response, and rollback automation usually appear first as faster recovery times.
2.3 Availability (Derived reliability metric)
Availability measures how consistently systems remain operational.
Rather than tracking individual incidents, it summarizes the overall reliability outcome experienced by users. It captures the cumulative effect of delivery and recovery practices over time.
Availability reflects the combined effect of:
High availability does not imply the absence of failures. It indicates that failures are infrequent, short-lived, and contained well enough that overall service continuity is preserved.
Cost and efficiency metrics connect delivery performance to financial outcomes. They show whether speed and reliability are achieved efficiently or depend on rising infrastructure spend, and whether delivery costs scale in proportion to value.
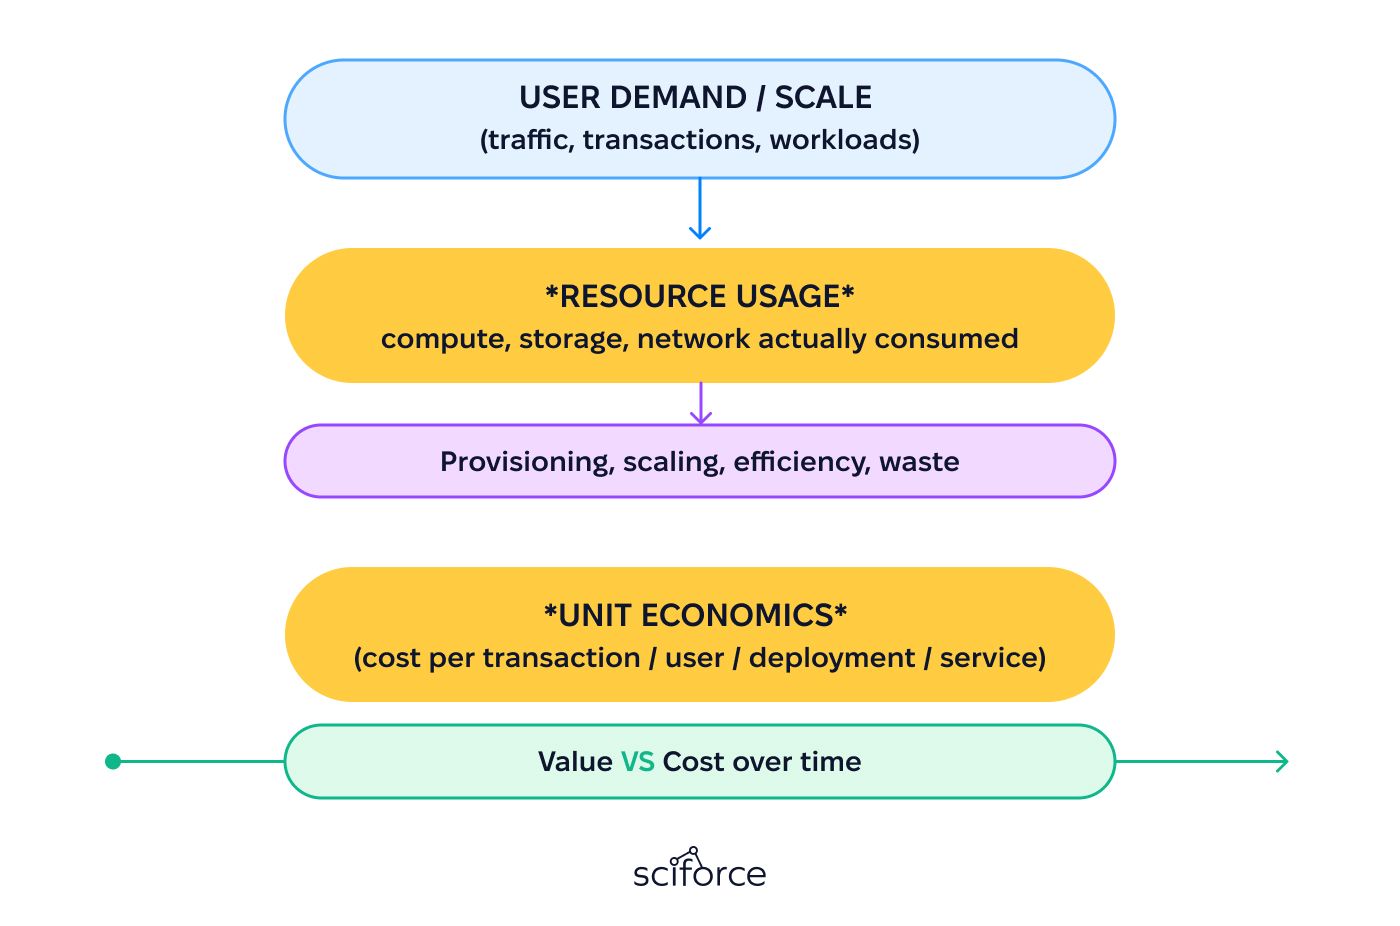
3.1 Unit Economics
Unit economics measure cost per unit of value, such as cost per transaction, user, deployment, or service. The concept comes from business and finance, but it has become increasingly relevant in DevOps as cloud-native systems scale.
In modern environments, delivery frequency, infrastructure usage, and reliability decisions directly affect unit cost. As a result, DevOps teams influence whether costs grow in proportion to value or faster than usage.
Unit economics matter more than total cloud spend because they show how costs behave as usage grows:
Without unit economics, teams may reduce cloud bills in the short term while masking structural cost problems that reappear at scale.
3.2 Resource Usage and Waste
Resource usage metrics show how much of the available compute, storage, and networking capacity is actually used.
Low usage means paying for resources that sit idle. Common reasons include provisioning for peak load that rarely occurs, idle workloads left running, inefficient scaling rules, and duplicated environments. Examples include:
Improving the metric lowers costs without slowing delivery or reducing reliability. In many cases, it is the fastest way to improve margins because it removes waste already built into the system.
As DevOps becomes responsible for cost, reliability, and margins, not all metrics remain useful. Many commonly tracked metrics show how busy teams are, but not whether delivery is actually improving. When decisions are based on these signals, teams may look productive while speed, stability, and cost efficiency fail to improve. Measuring activity creates motion, not meaningful progress.
The following metrics are still widely used, but provide limited insight into delivery effectiveness or financial impact:
Number of commits or pull requests High commit or PR volume reflects coding activity, not how quickly changes reach production or how stable they are once deployed.
Tickets closed or story points completed These metrics track workload throughput within a team, but stop at the planning boundary. They don’t show whether work reaches production, increases risk, or leads to faster feedback and value.
Build counts or pipeline runs Frequent builds show pipeline activity, not delivery performance. Build volume alone does not reflect lead time, failure rate, or recovery speed.
Total cloud spend (without context) It does not show whether higher spend reflects growth, better performance, or wasted capacity, and can hide rising unit costs.
These metrics can improve in isolation while delivery outcomes, reliability, and margins quietly deteriorate.
Activity metrics are easy to collect and report, but they say little about whether delivery is actually improving. They show how busy teams are, not the results of their work.
Because of this, they fail to answer the questions leadership needs to understand:
Without cost and outcome context, activity metrics push teams to optimize individual tasks or tools instead of improving the delivery system as a whole.
Outcome-focused metrics we talked about earlier align delivery performance with business results:
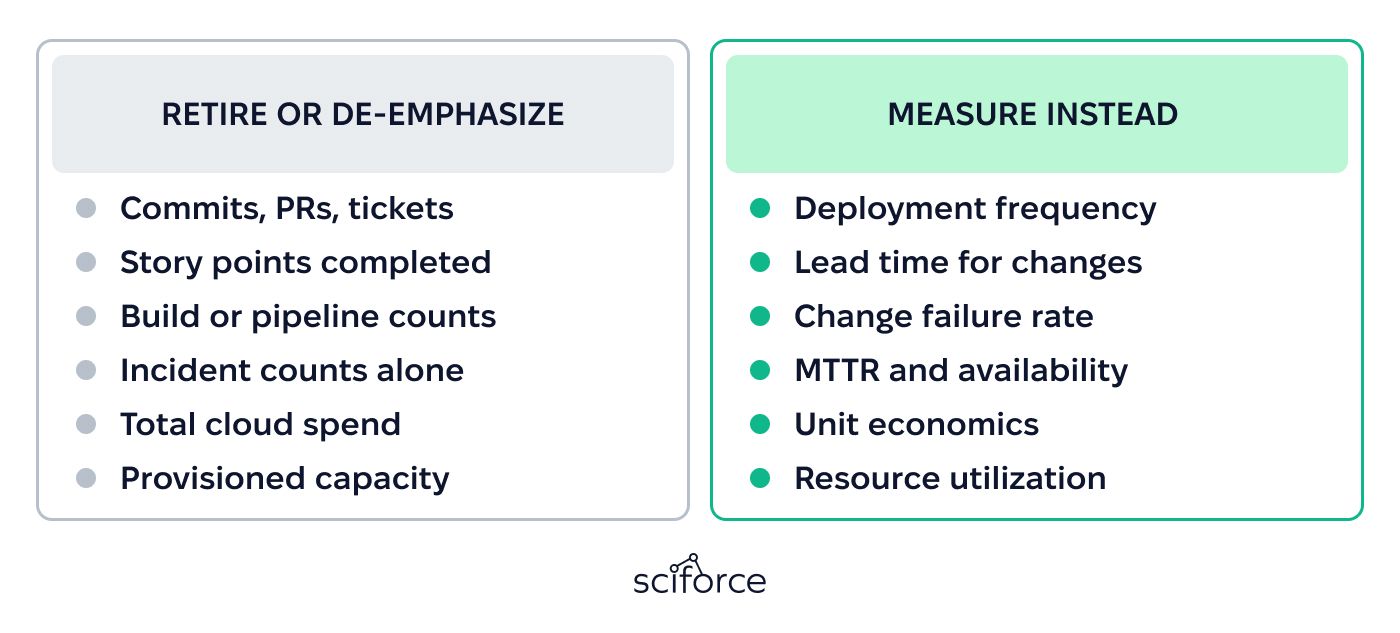
In 2026, DevOps maturity is about results, not activity. What matters is whether delivery improves speed, reliability, and cost efficiency at the same time.
Metrics that focus on activity can make teams look productive, but they don’t show whether systems are becoming faster, more stable, or cheaper to run. The metrics that matter connect delivery work to financial outcomes. They help teams see trade-offs, understand whether systems scale efficiently or deteriorate as they grow.
Want to improve delivery speed, reliability, or cloud cost efficiency? Book a free consultation to discuss how your DevOps setup can better support your business goals.